# load packages
library(tidyverse)   # for data wrangling and visualization
library(broom)       # for formatting model output
library(ggformula)   # for creating plots using formulas
library(scales)      # for pretty axis labels
library(knitr)       # for pretty tables
library(moderndive)  # for house_price dataset
library(fivethirtyeight)   # for fandango dataset
library(kableExtra)  # also for pretty tables
library(patchwork)   # arrange plots

# set default theme and larger font size for ggplot2
ggplot2::theme_set(ggplot2::theme_bw(base_size = 20))SLR: Outliers
Example: Movie scores
- Data behind the FiveThirtyEight story Be Suspicious Of Online Movie Ratings, Especially Fandango’s
- In the fivethirtyeight package:
fandango - Contains every film released in 2014 and 2015 that has at least 30 fan reviews on Fandango, an IMDb score, Rotten Tomatoes critic and user ratings, and Metacritic critic and user scores


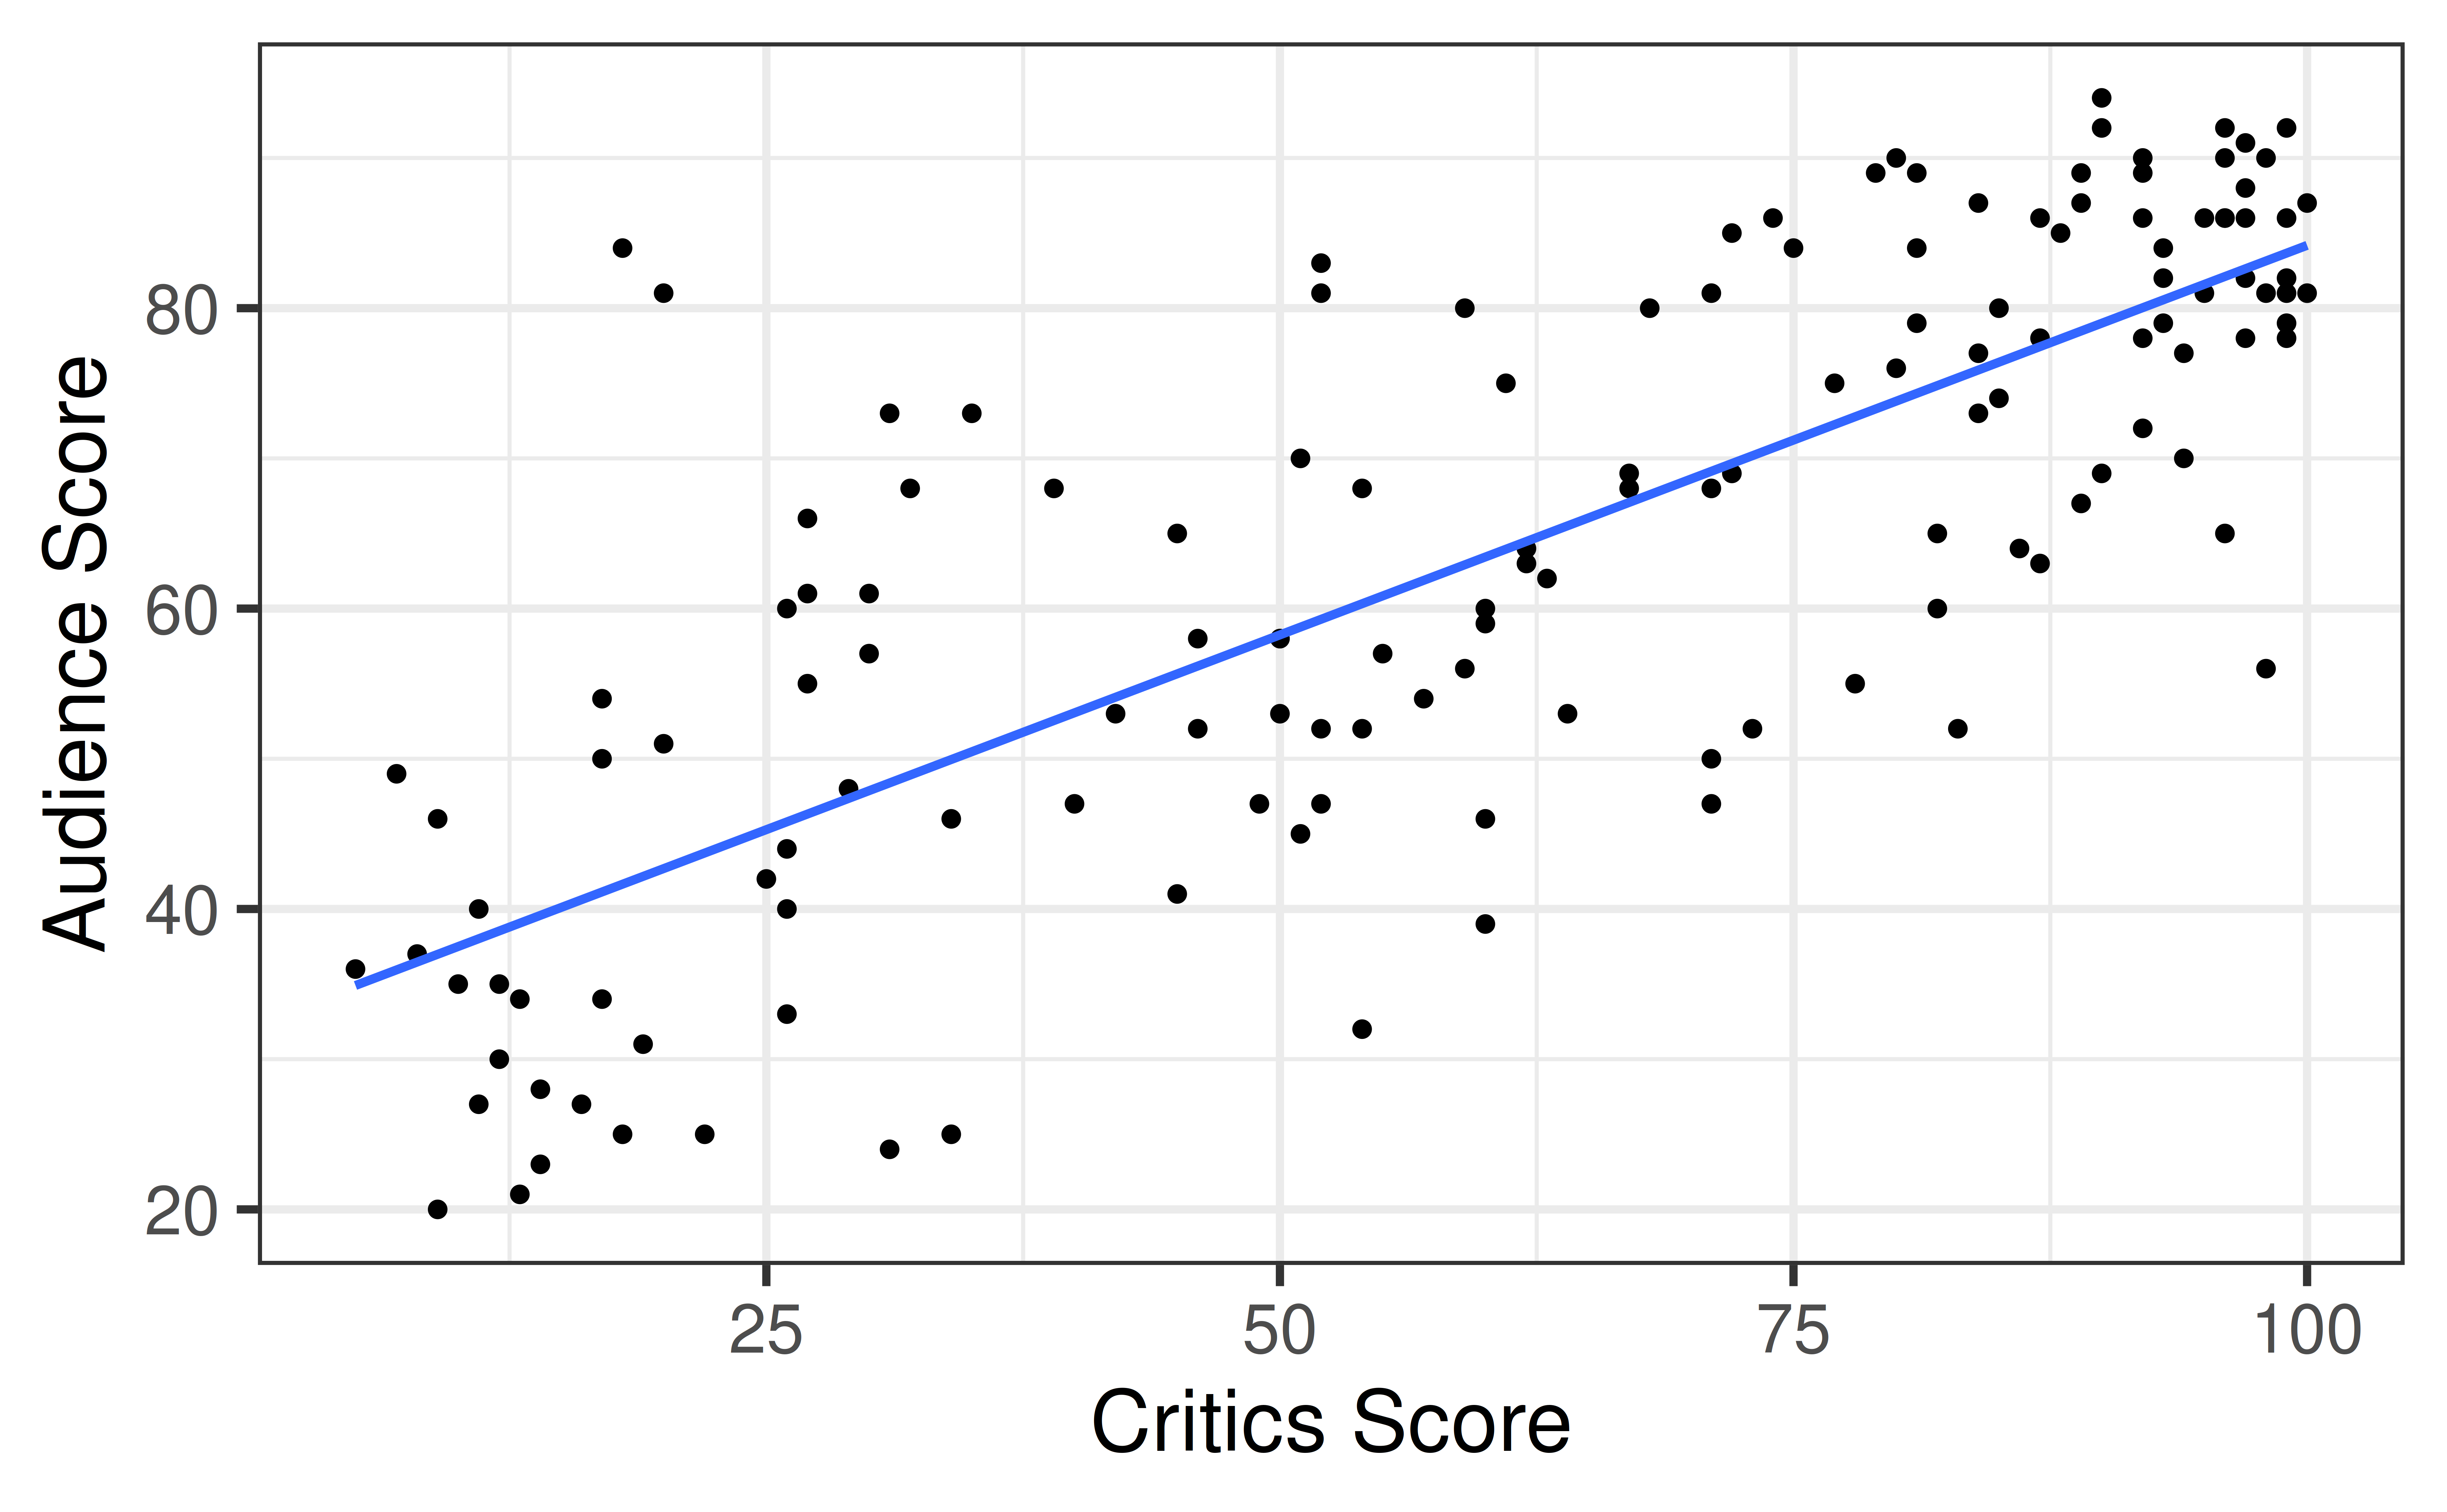
Example: Movie Scores
Boxplot of Residuals
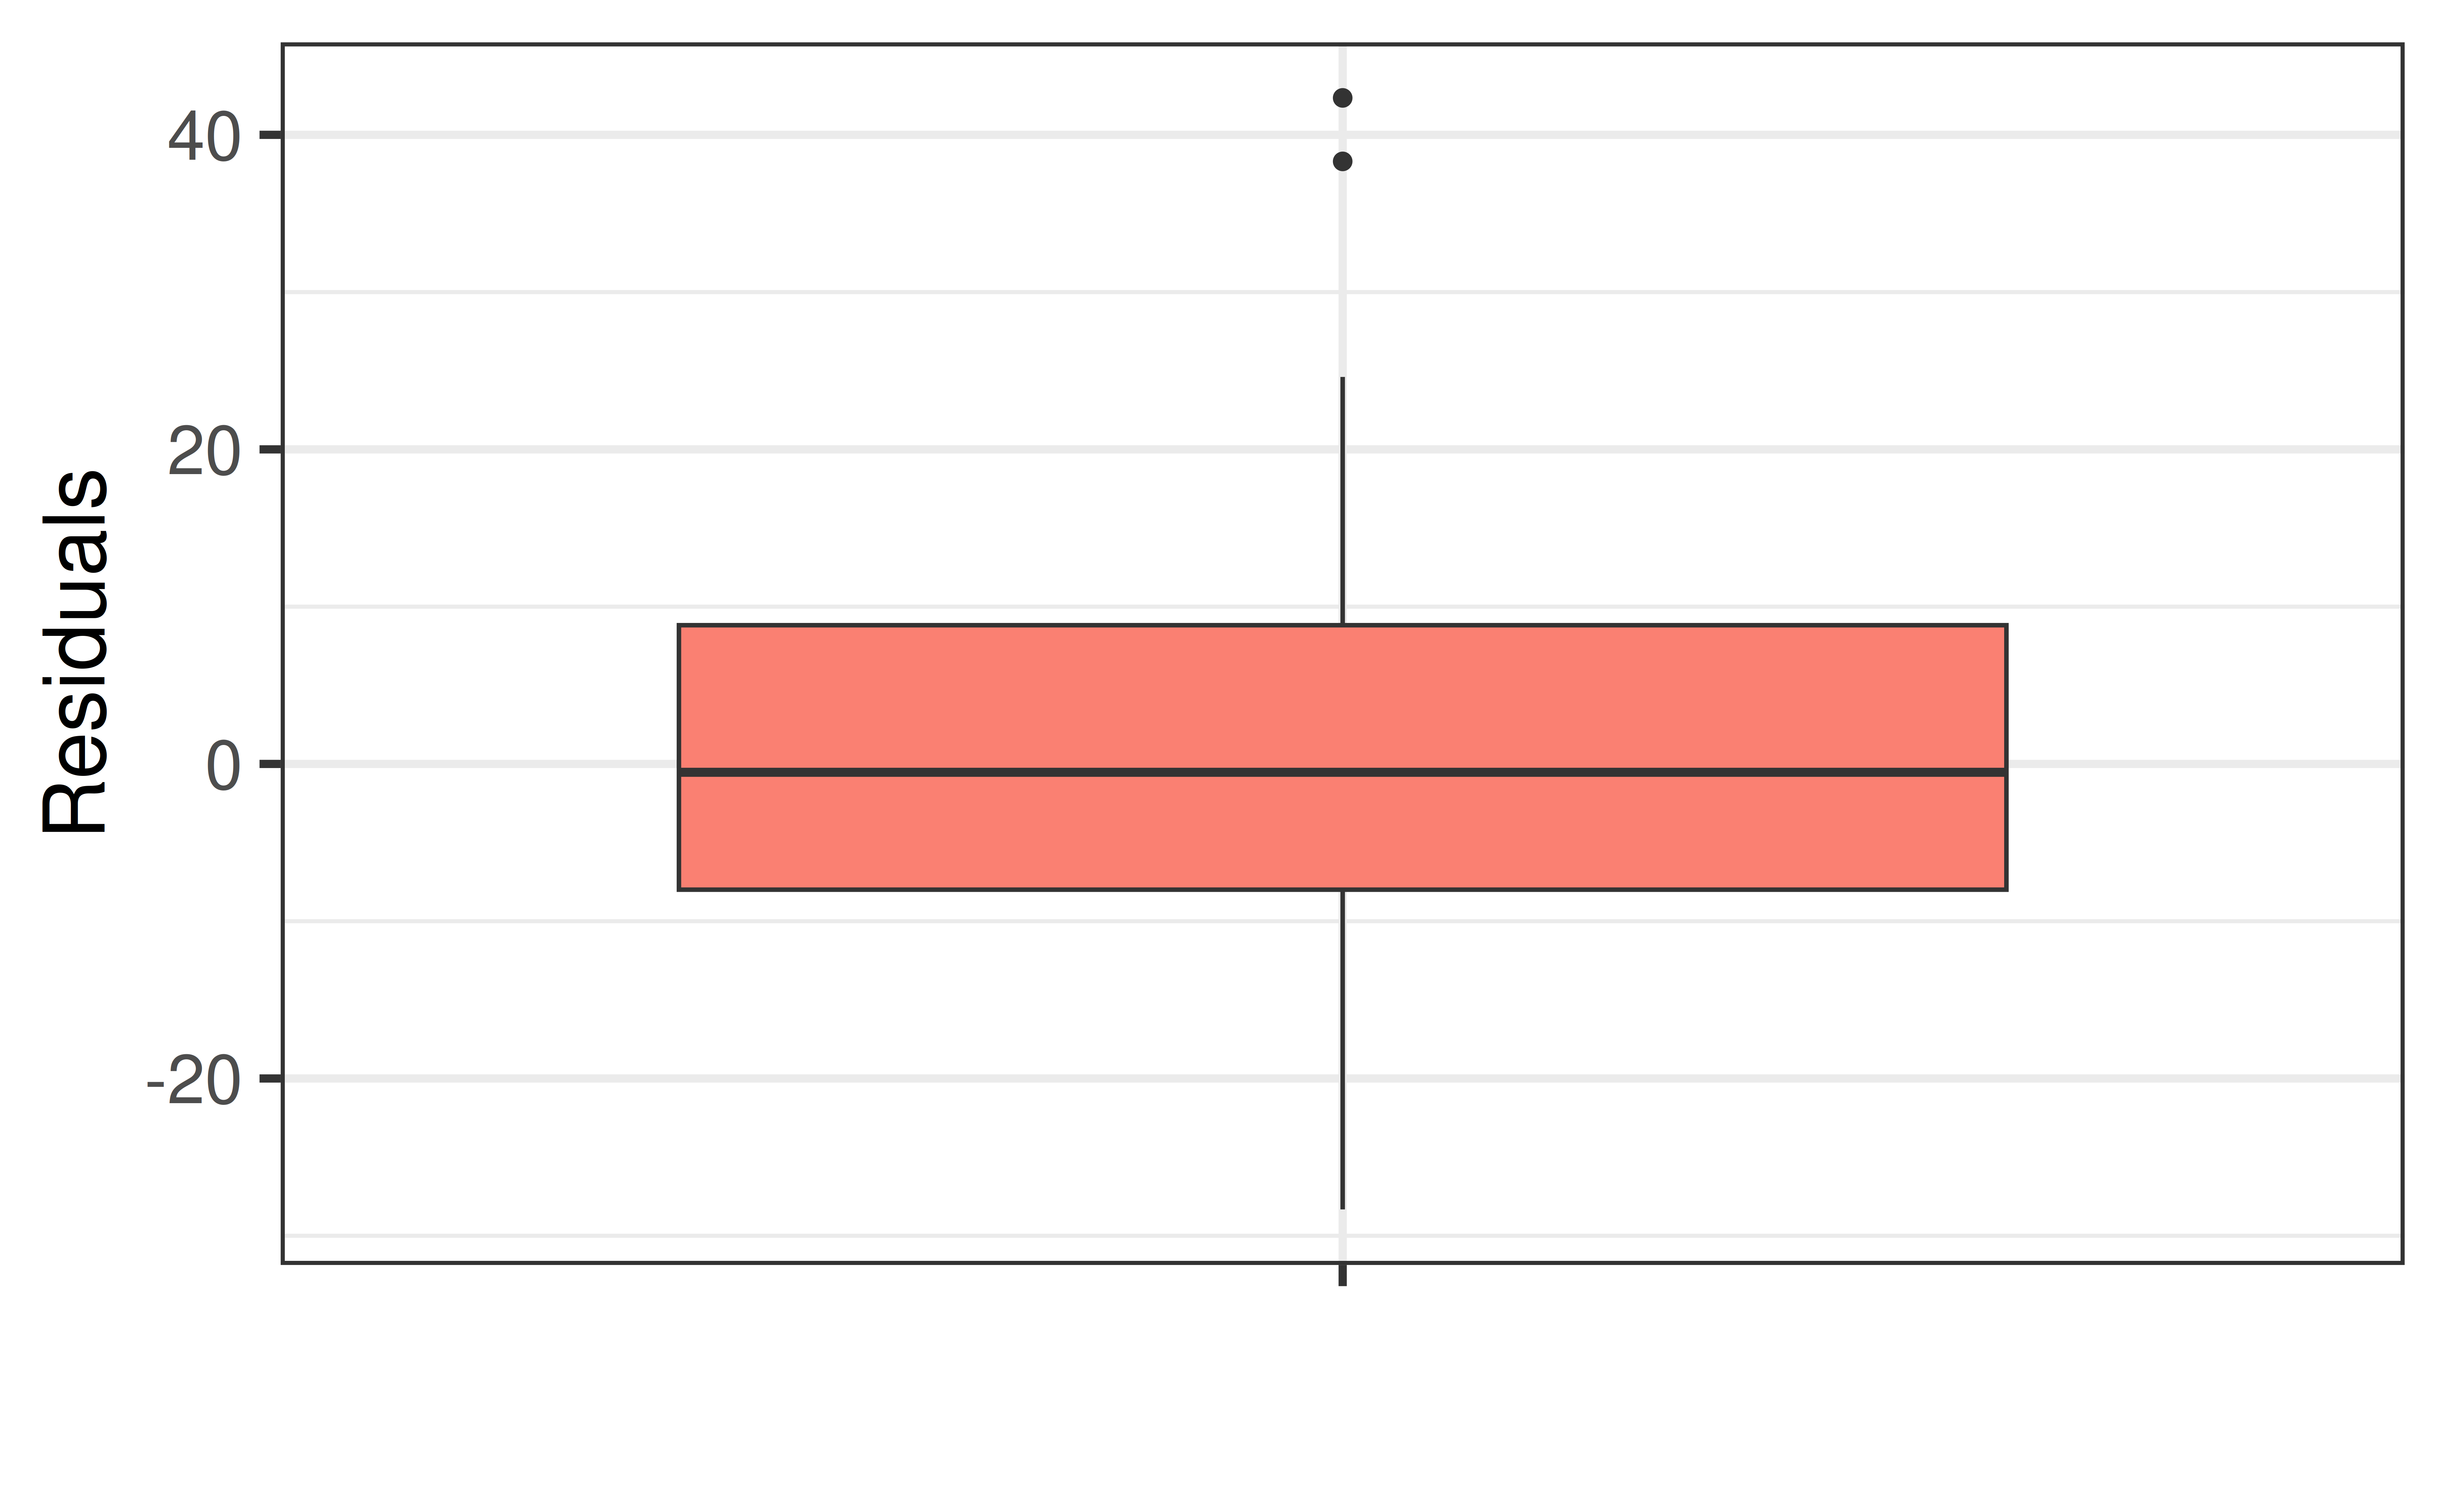
- Dots (outliers) indicate data points more than 1.5 IQRs above (or below) quartiles
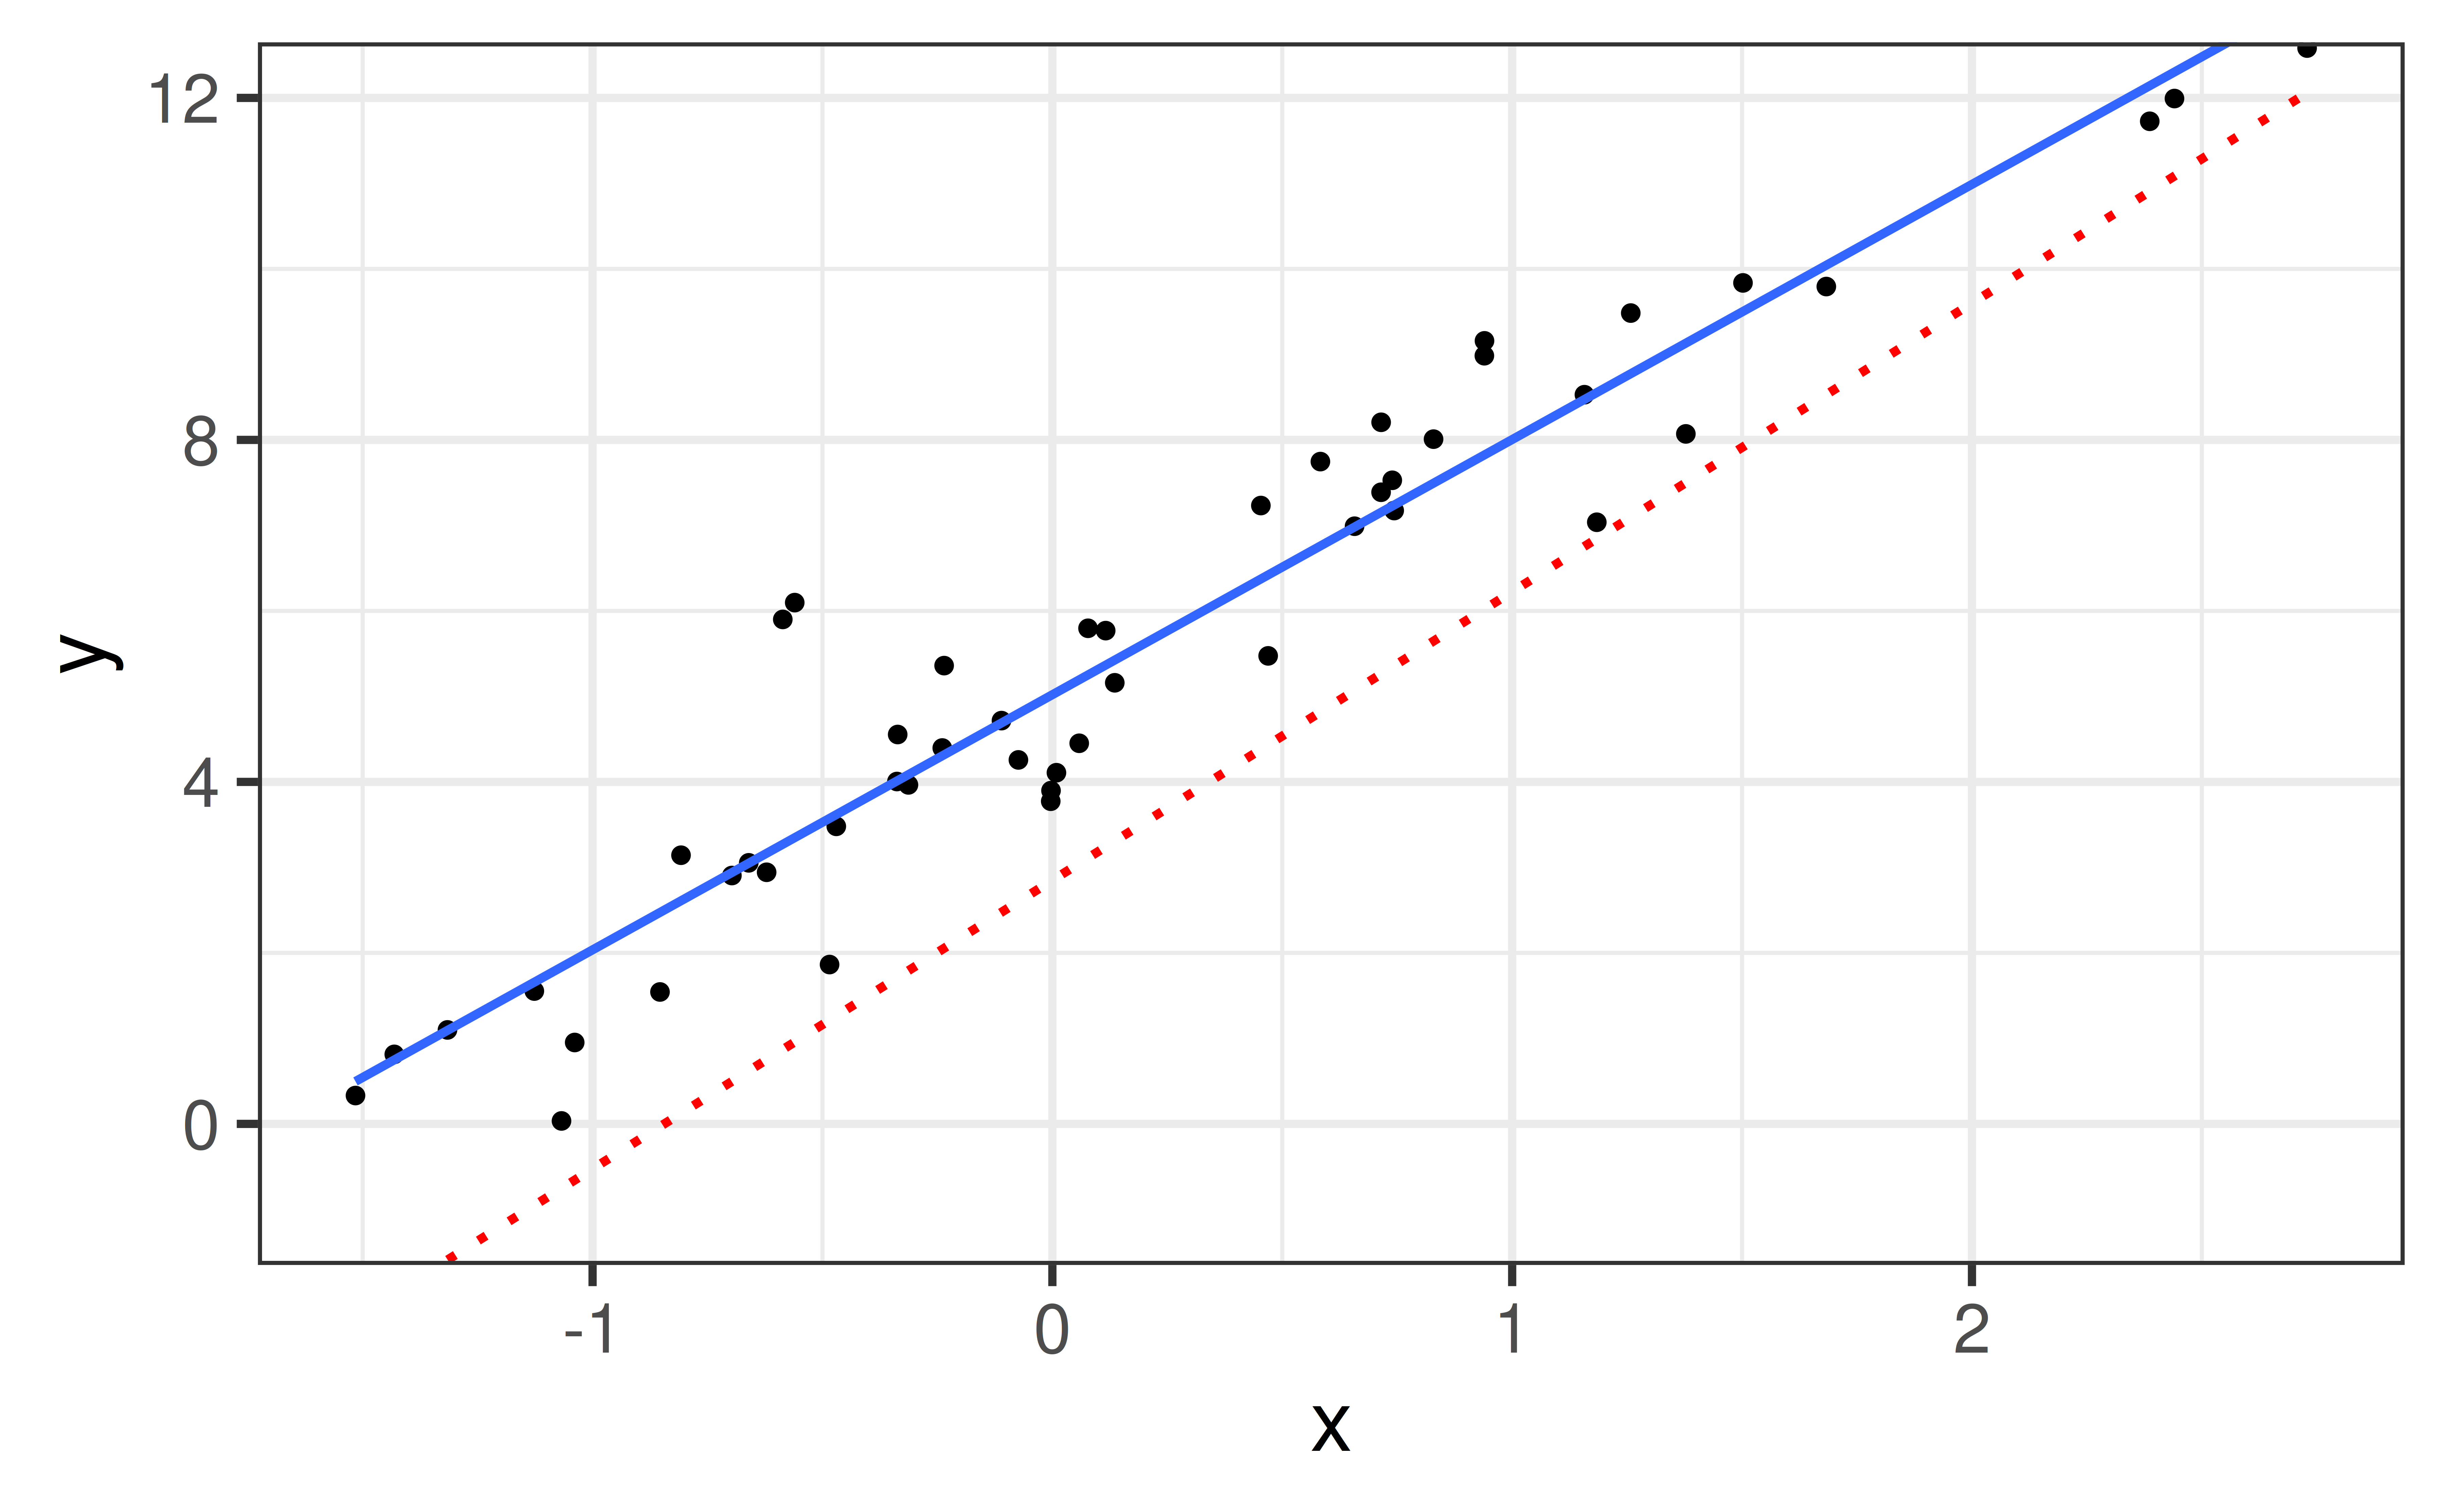
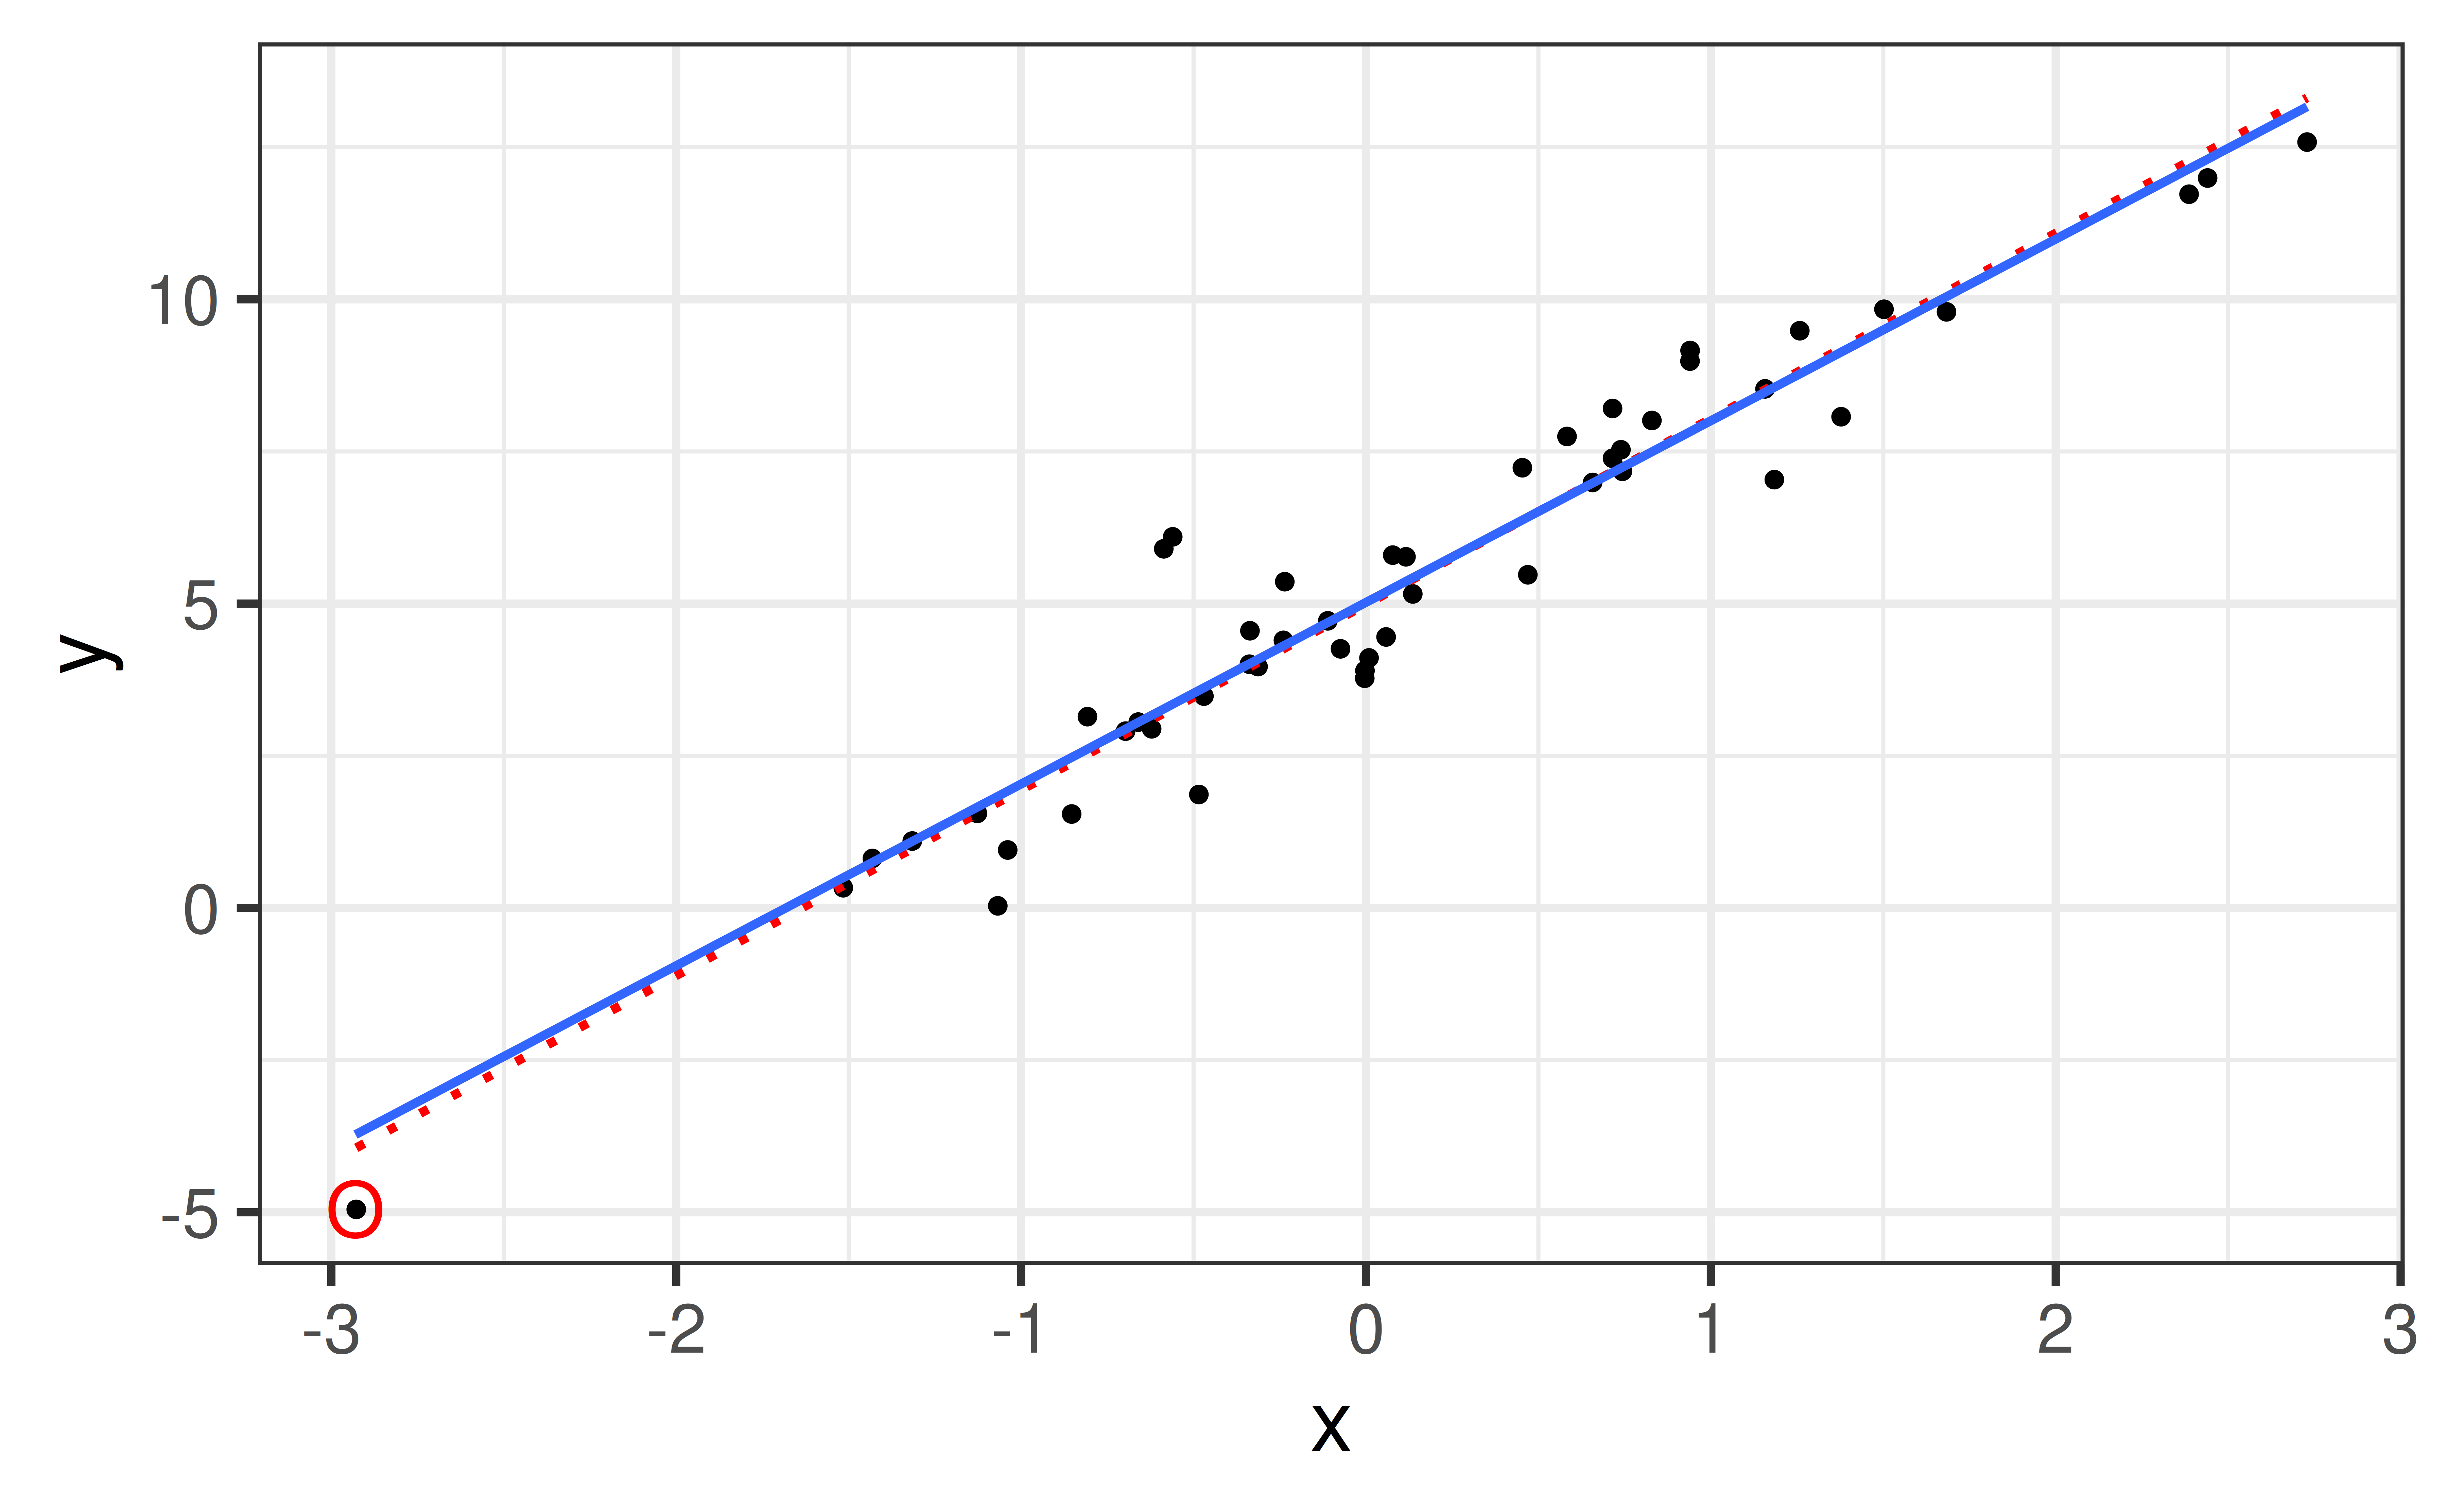
High Leverage, Low Influence
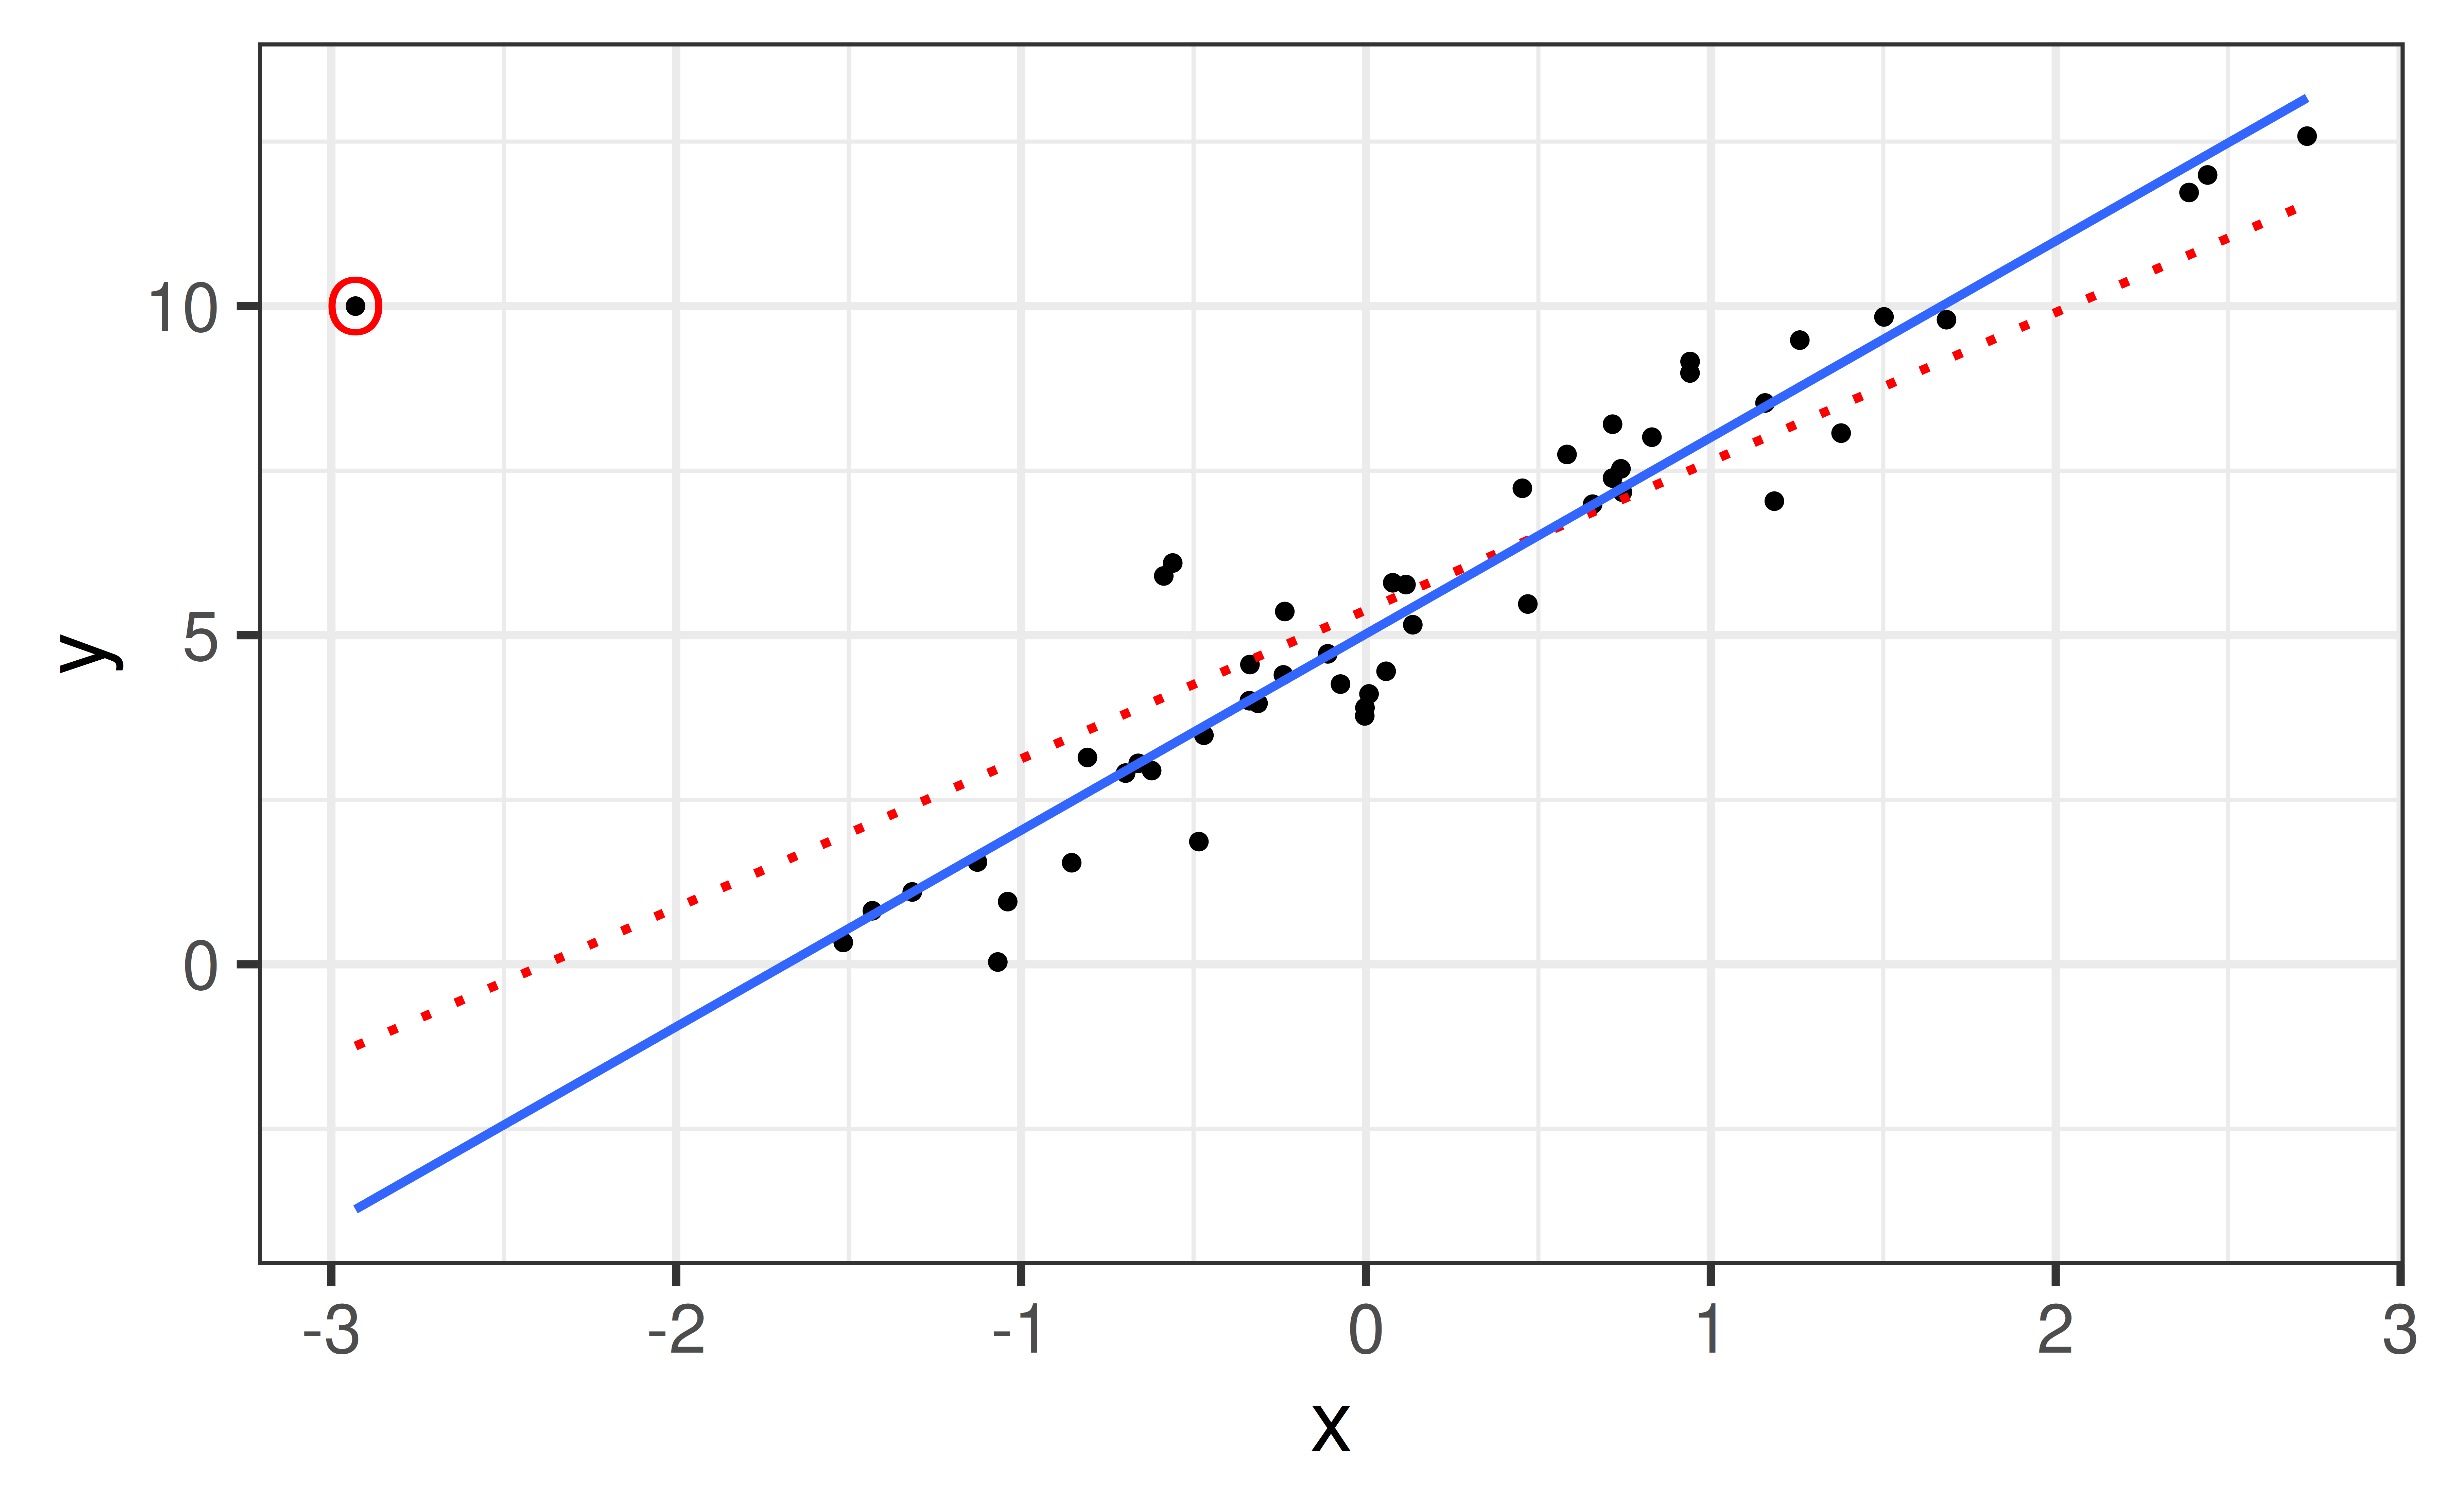
High Leverage, High Influence
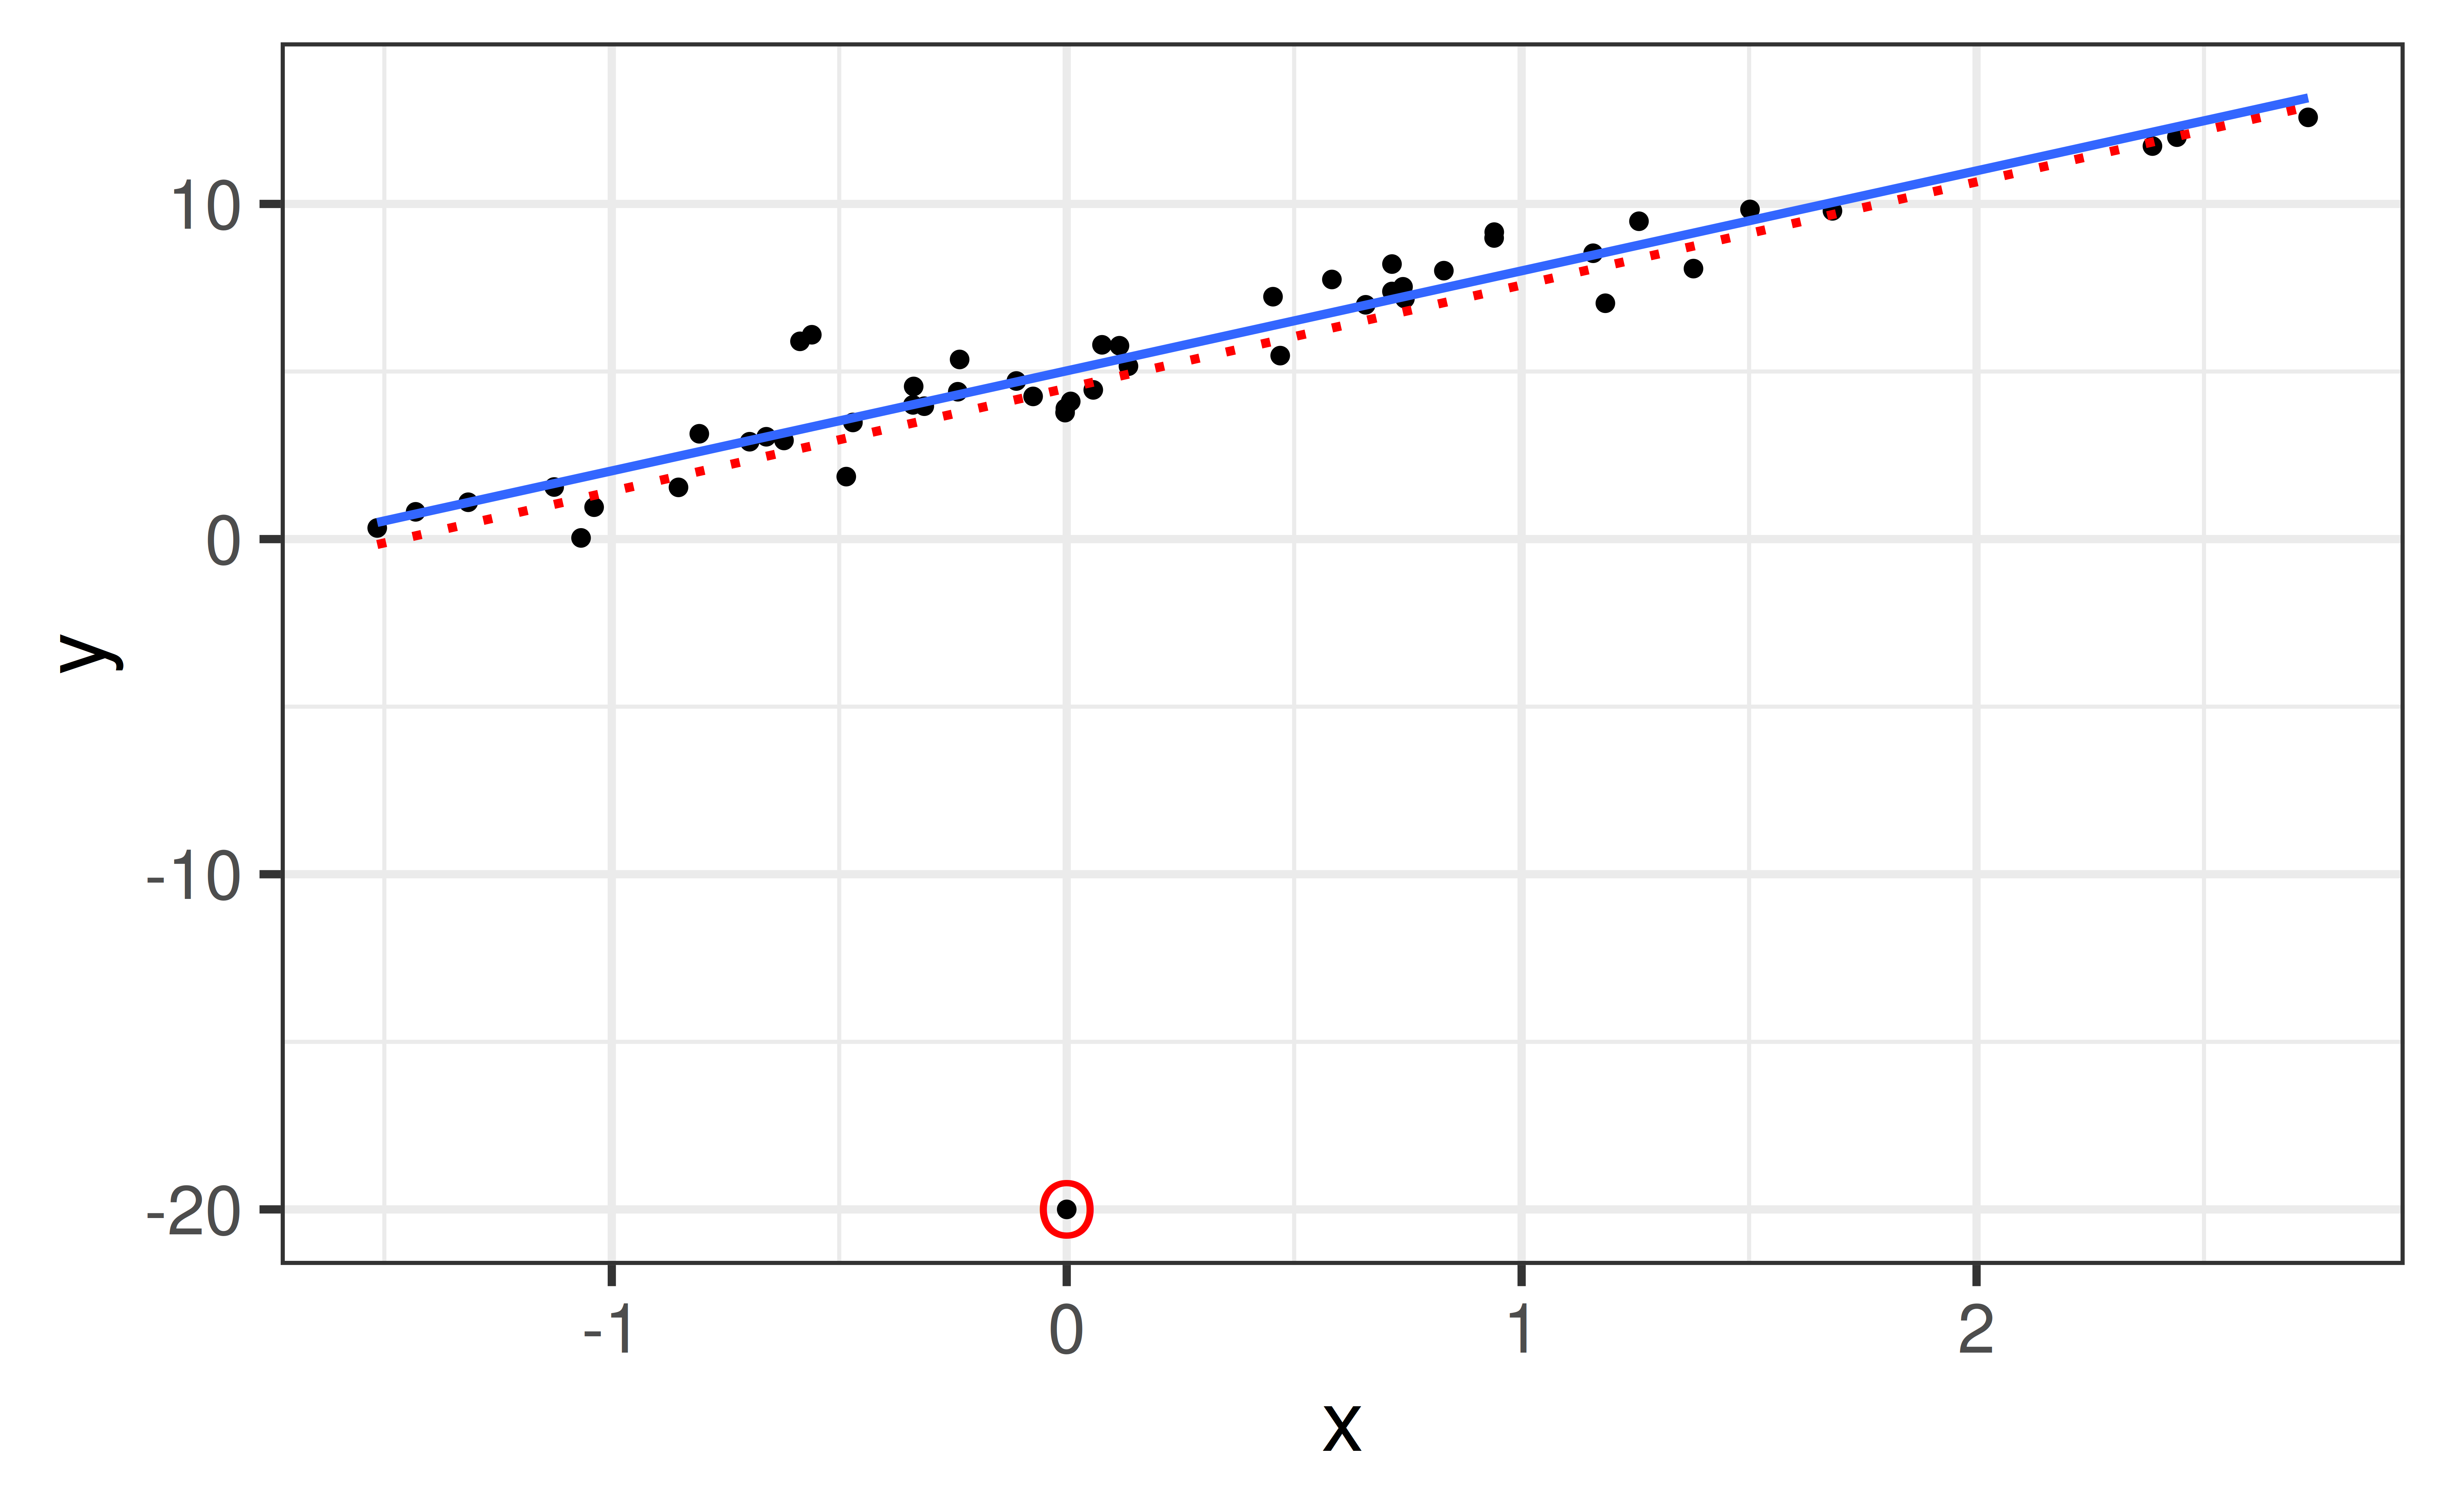
Low Leverage, Low Influence
Low Leverage, High Influence
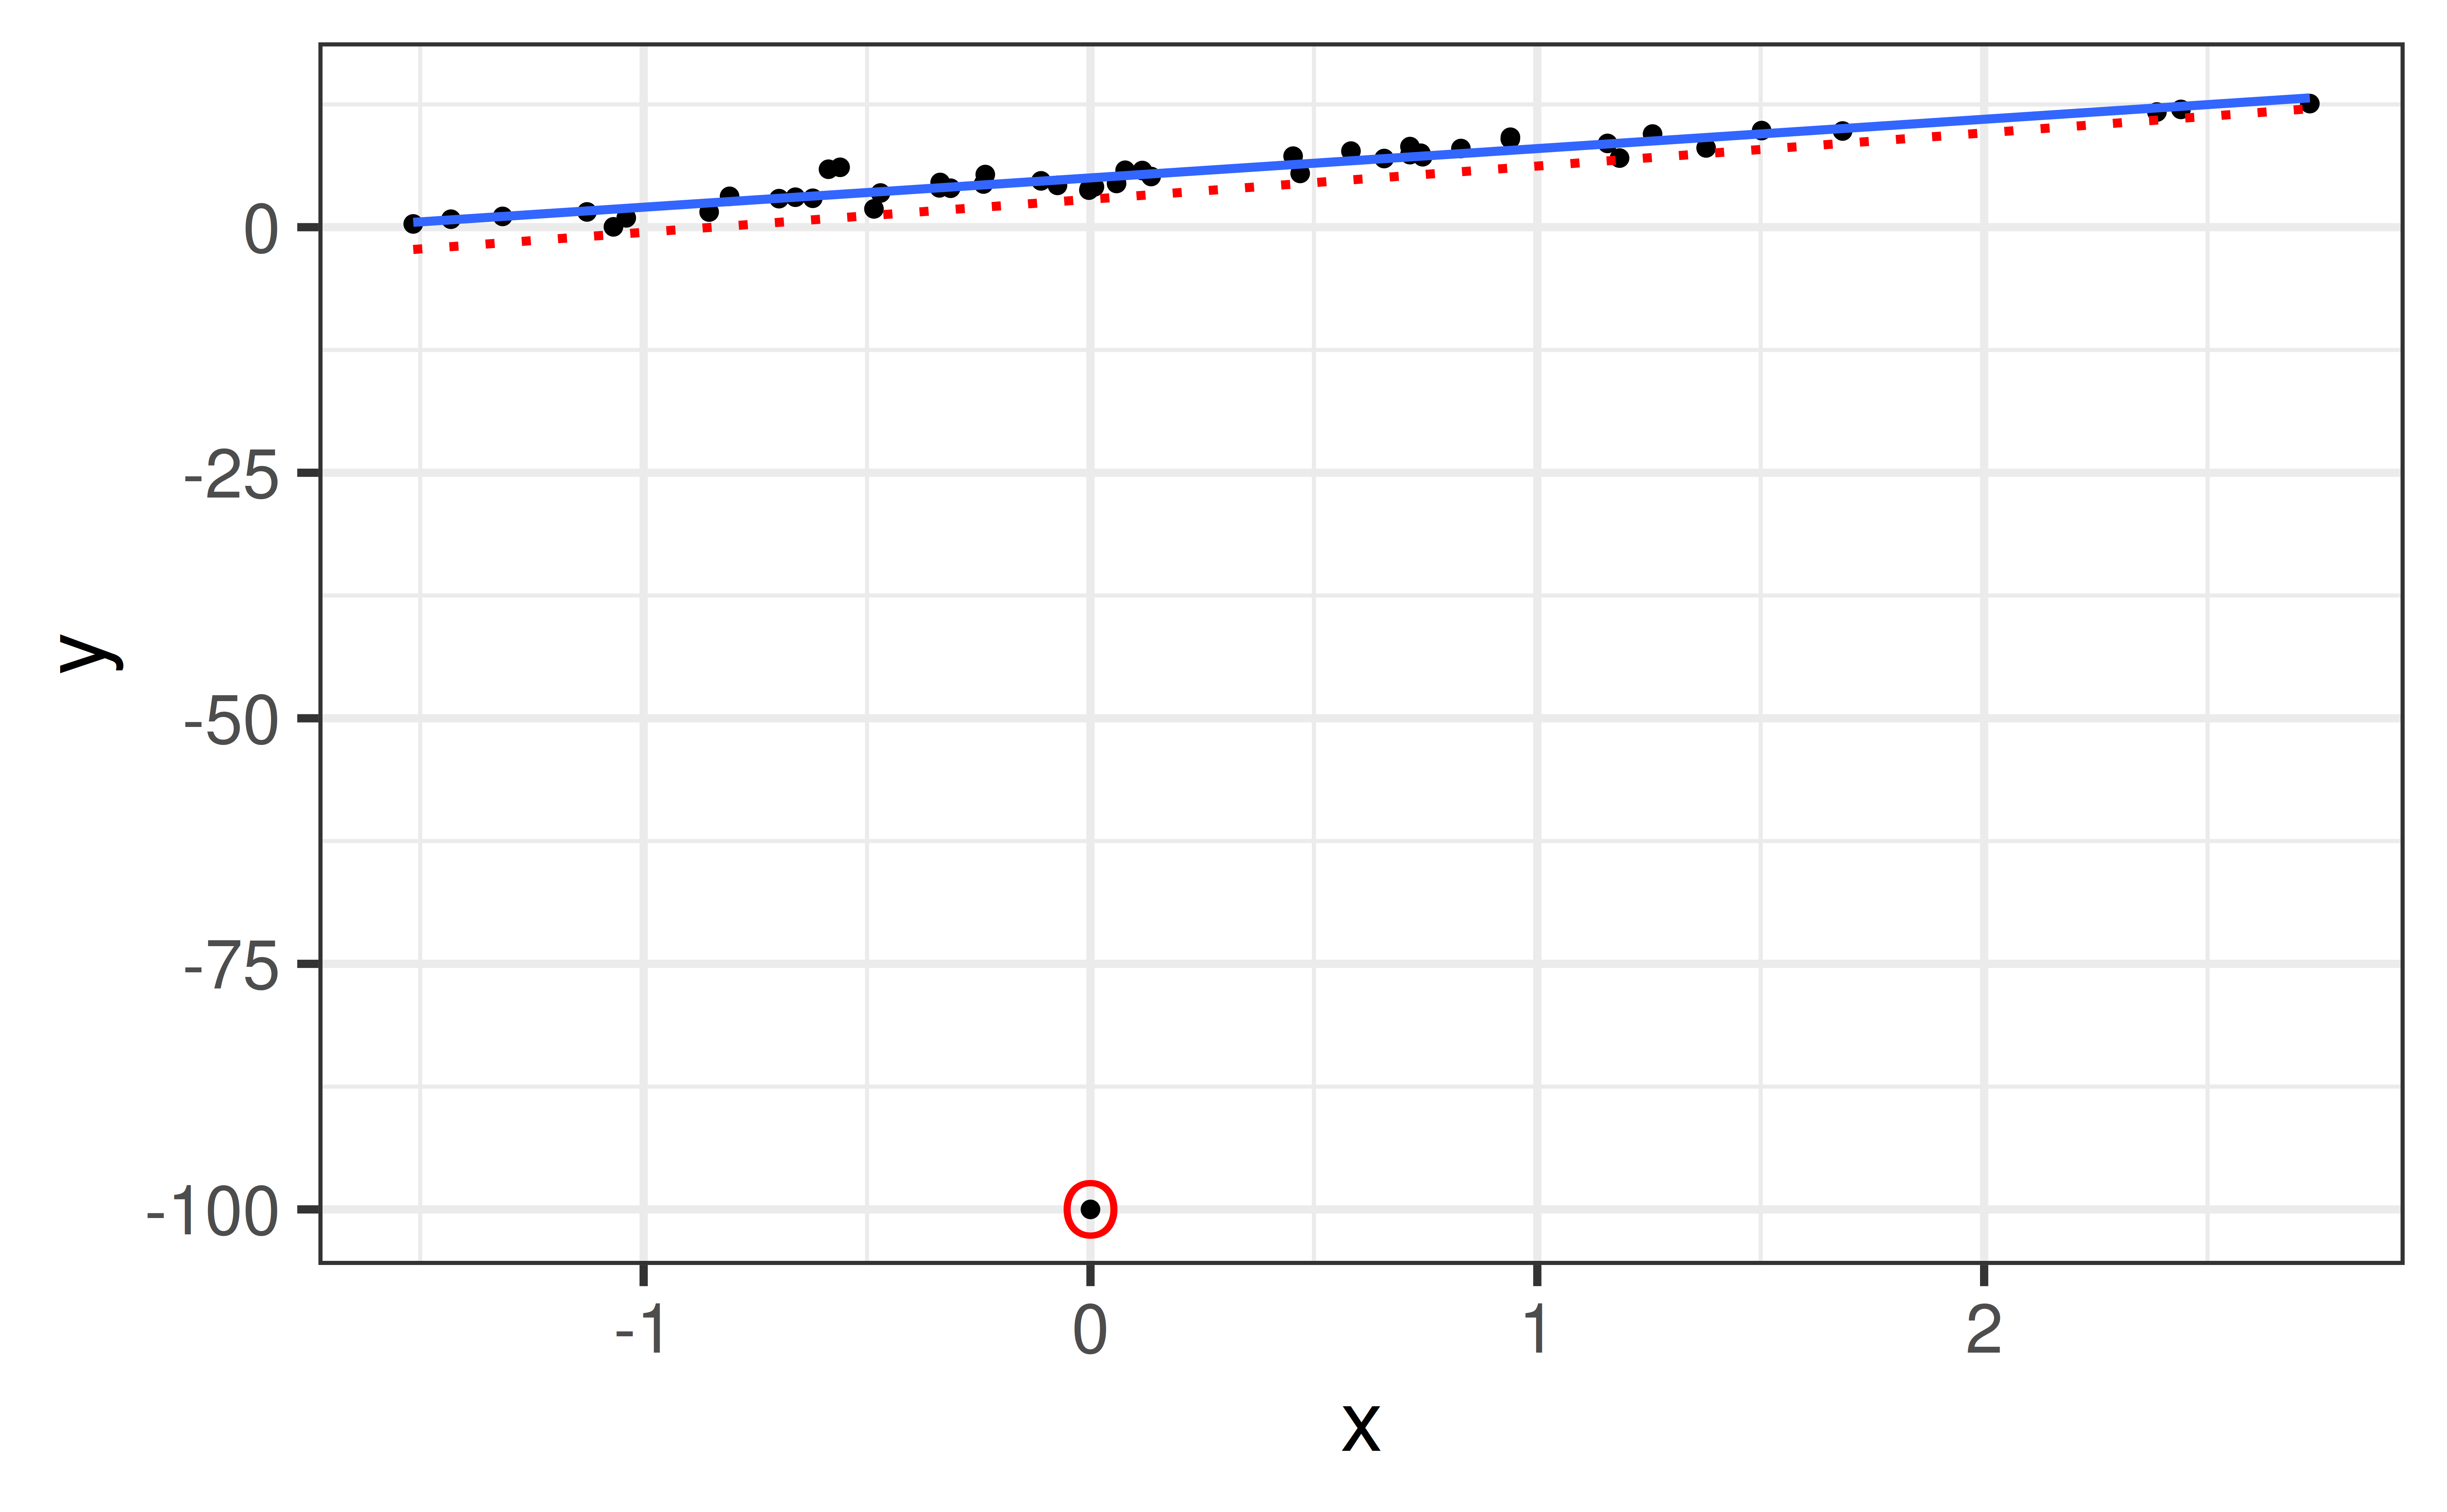
Low Leverage, High Influence