Multivariate Relationships

Prof. Eric Friedlander

Multivariate Relationships

  • Complete Exercises 1-5

Carbohydrates in Starbucks food

  • Starbucks often displays the total calories in their food items but not the other nutritional information.

  • Carbohydrates are a body’s main fuel source. The Dietary Guidelines for America recommend that carbohydrates make up 45% to 65% of total daily calories.1

  • Our goal is to understand the relationship between the amount of carbohydrates and calories in Starbucks food items. We’d also like to assess if the relationship differs based on the type of food item (bakery, salad, sandwich, etc.)

Complete the activity.

Starbucks data

library(openintro)

starbucks <- starbucks |> 
  mutate(bakery = factor(if_else(type == "bakery", "bakery", "non-bakery")))

glimpse(starbucks)
Rows: 77
Columns: 8
$ item     <chr> "8-Grain Roll", "Apple Bran Muffin", "Apple Fritter", "Banana…
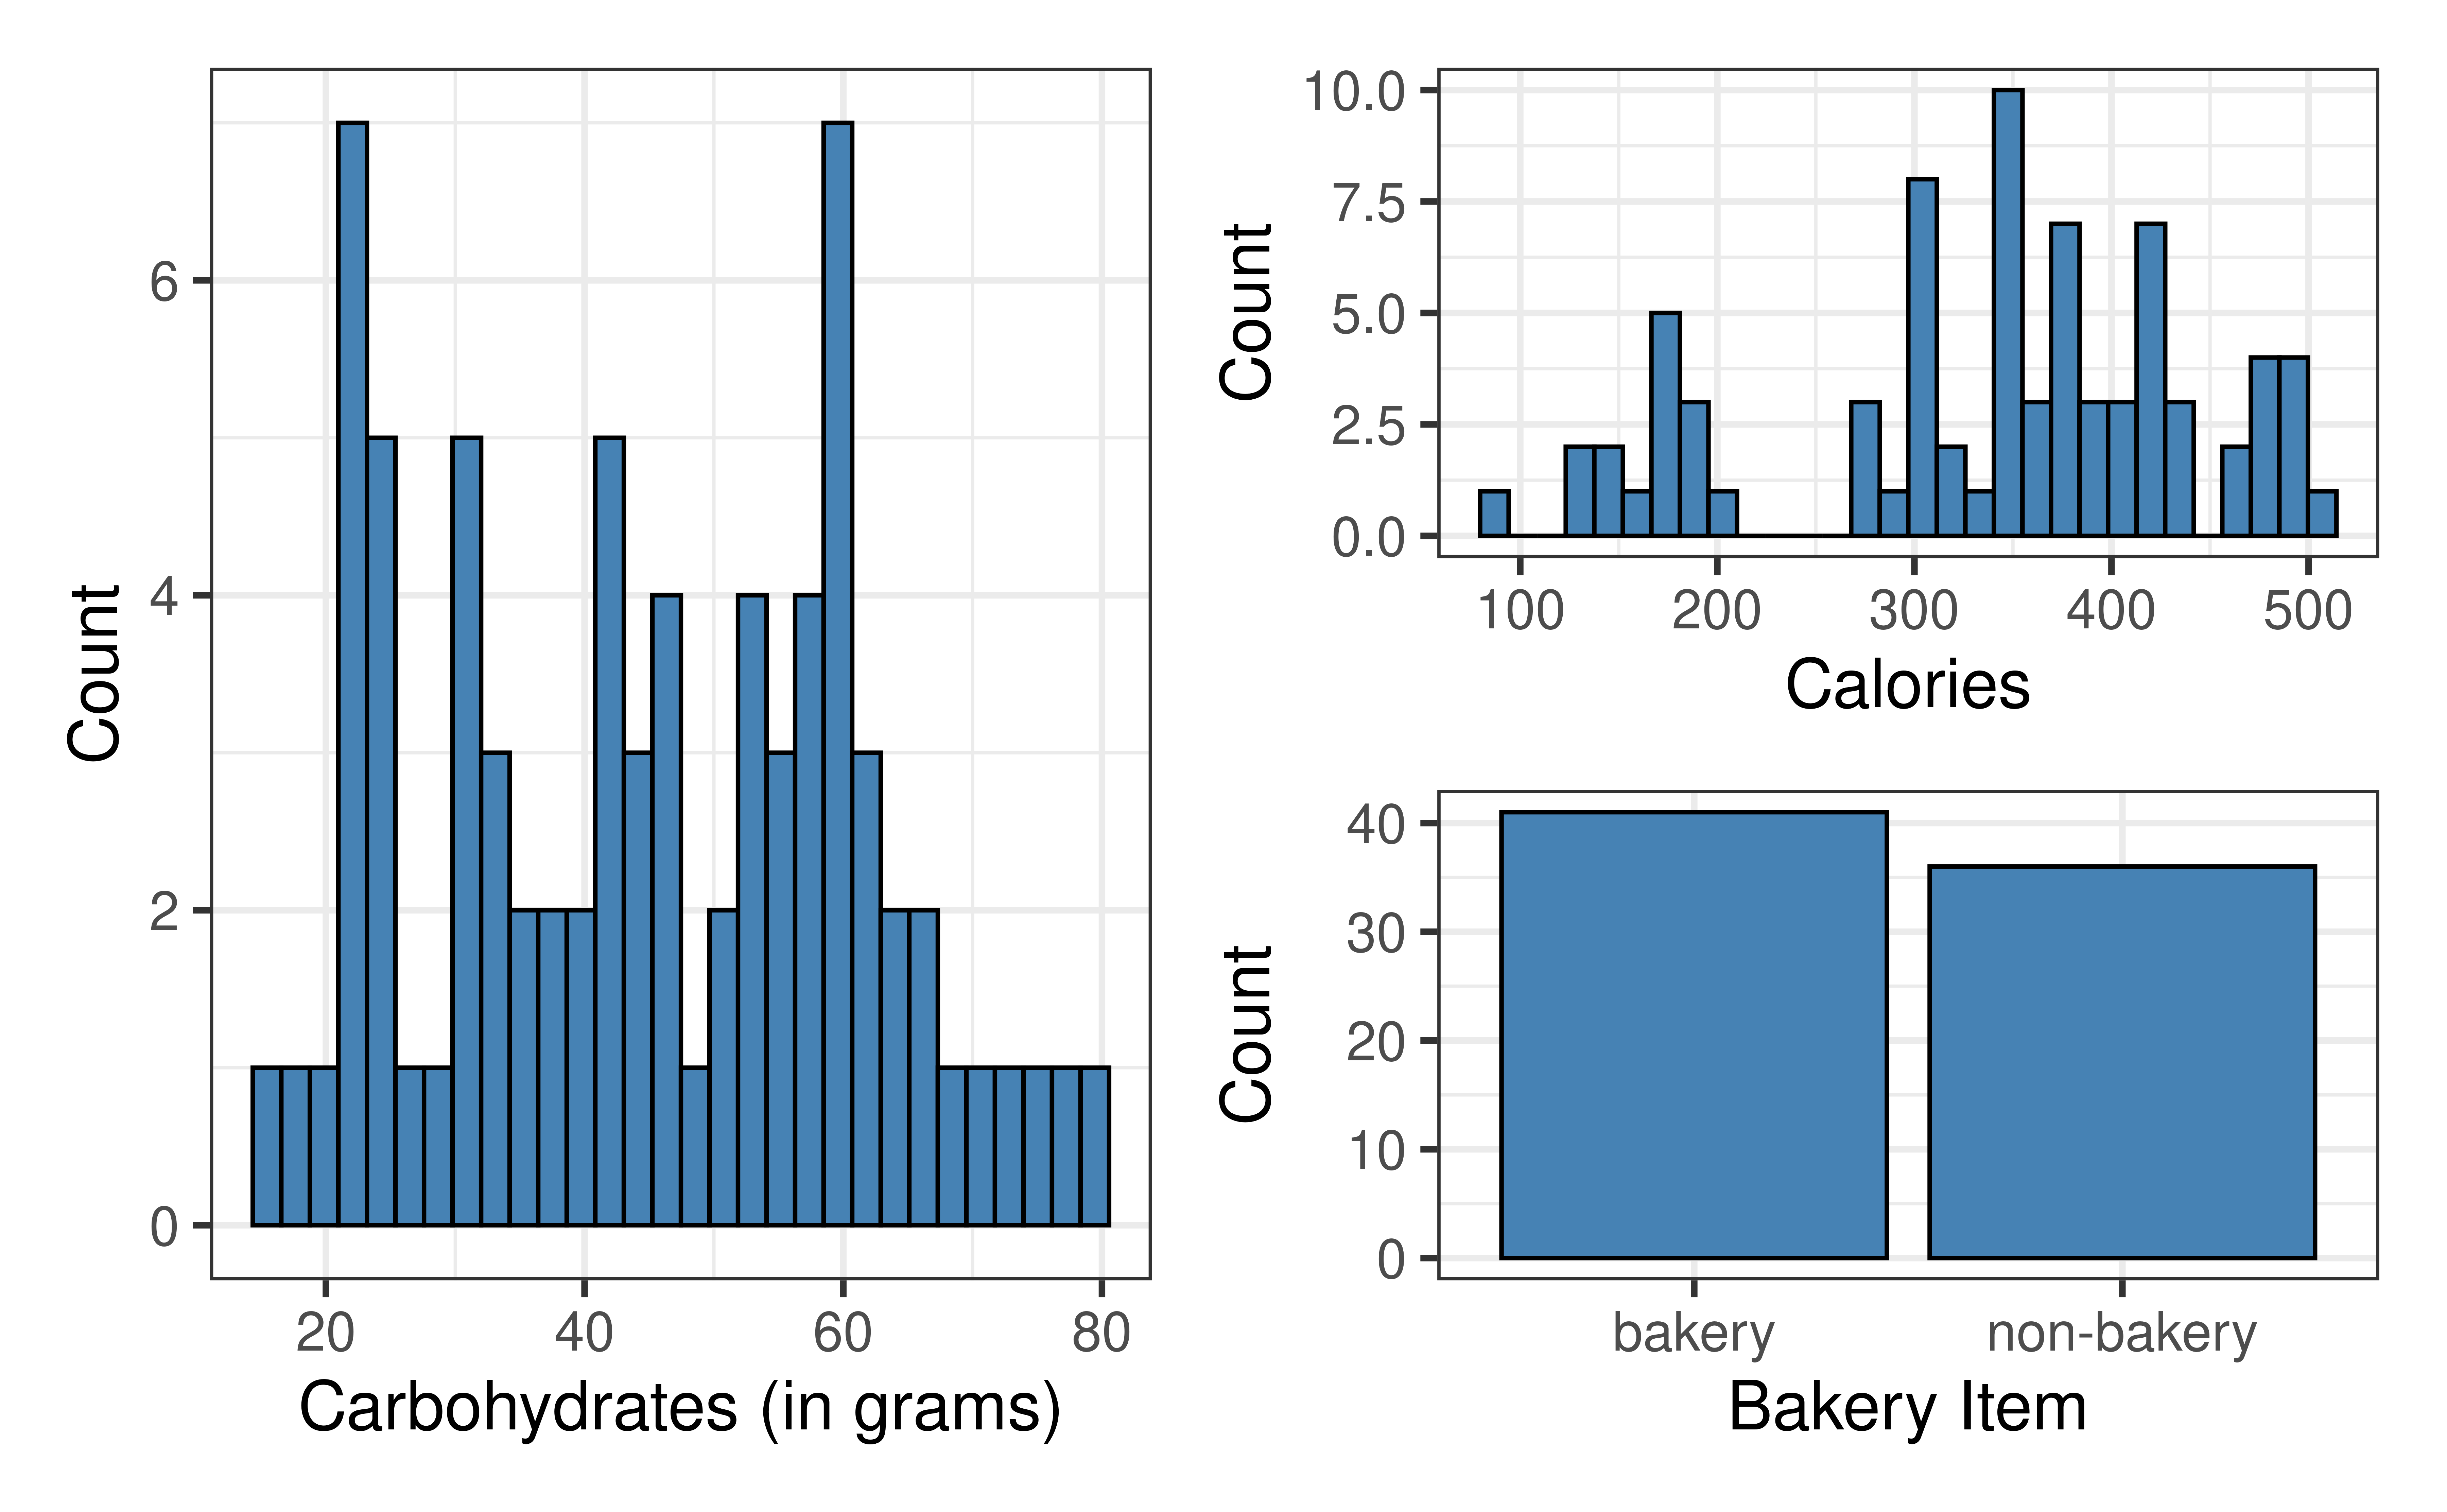
$ calories <int> 350, 350, 420, 490, 130, 370, 460, 370, 310, 420, 380, 320, 3…
$ fat      <dbl> 8, 9, 20, 19, 6, 14, 22, 14, 18, 25, 17, 12, 17, 21, 5, 18, 1…
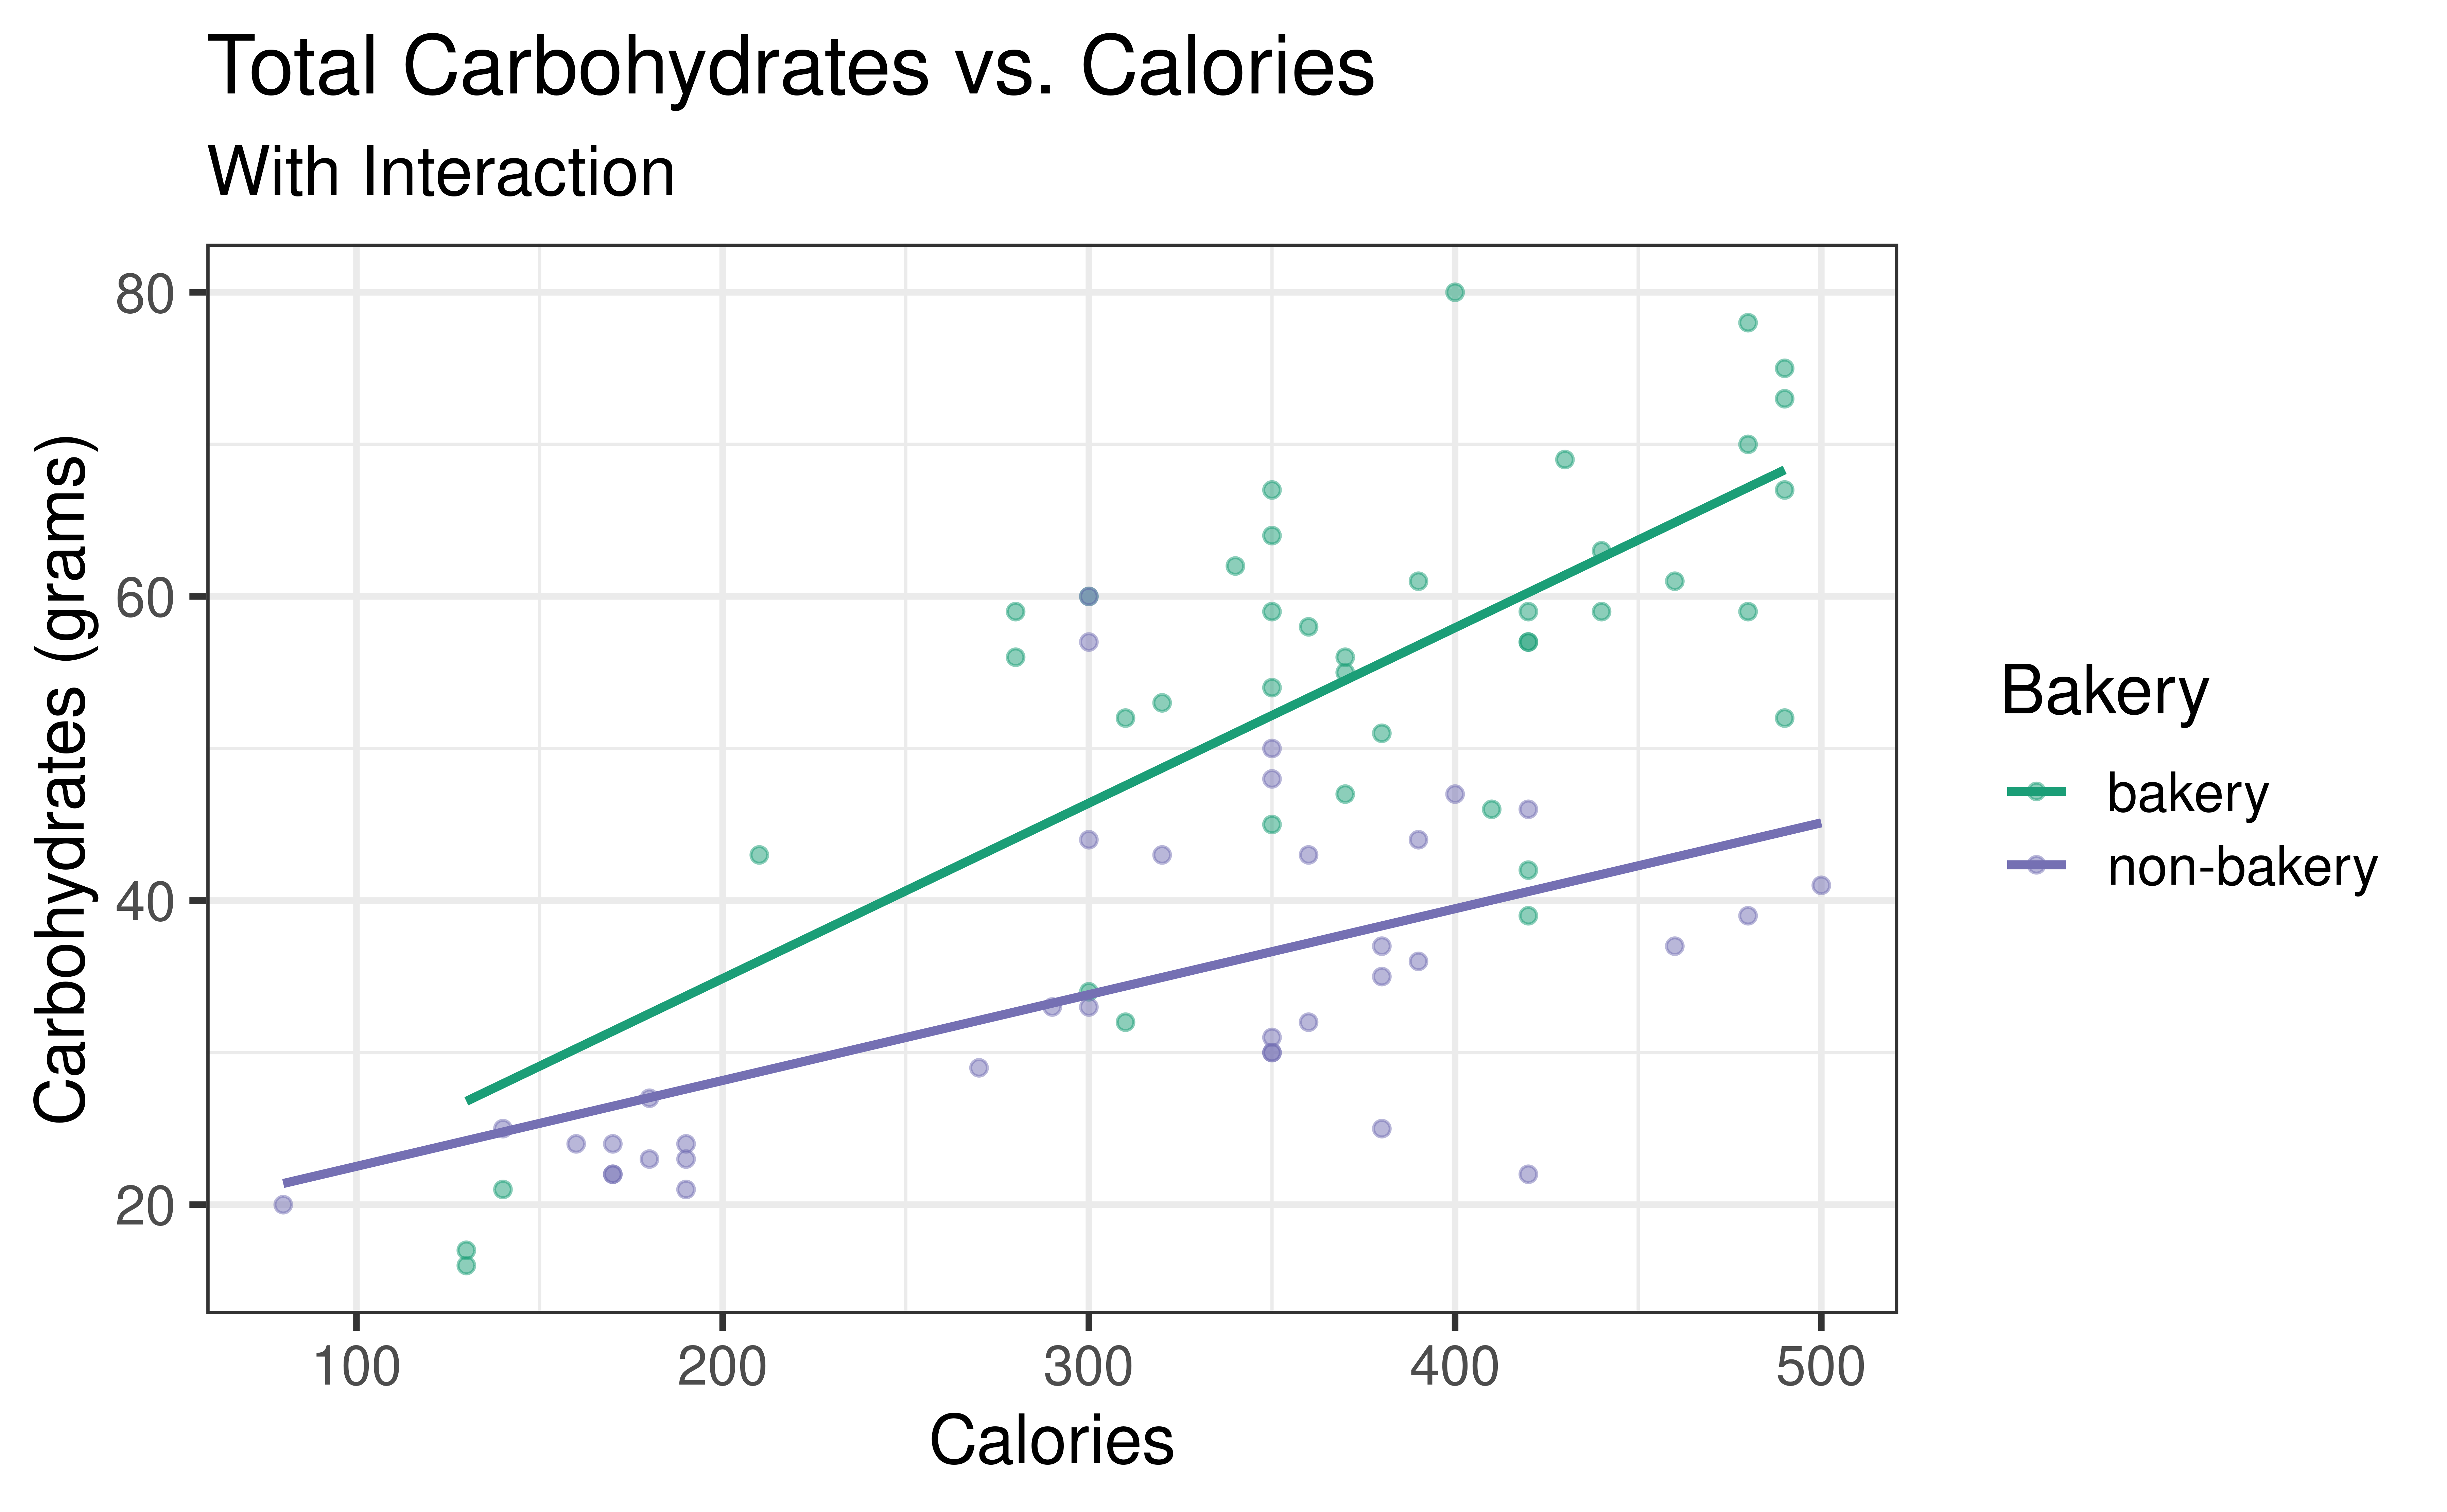
$ carb     <int> 67, 64, 59, 75, 17, 47, 61, 55, 32, 39, 51, 53, 34, 57, 52, 7…
$ fiber    <int> 5, 7, 0, 4, 0, 5, 2, 0, 0, 0, 2, 3, 2, 2, 3, 3, 2, 3, 0, 2, 0…
$ protein  <int> 10, 6, 5, 7, 0, 6, 7, 6, 5, 7, 4, 6, 5, 5, 12, 7, 8, 6, 0, 10…
$ type     <fct> bakery, bakery, bakery, bakery, bakery, bakery, bakery, baker…
$ bakery   <fct> bakery, bakery, bakery, bakery, bakery, bakery, bakery, baker…
  • Observations: 77 Starbucks food items
  • Variables:
    • carb: Total carbohydrates (in grams)
    • calories: Total calories
    • bakery: bakery: bakery food item, non-bakery: other food type

Terminology

  • carb is the response variable
    • variable whose variation we want to understand / variable we wish to predict
    • also known as outcome or target variable
  • calories, bakery are the explanatory variables
    • variables used to account for variation in the response
    • also known as predictor, or input variables

Complete the remainder of the Exercises.

Univariate exploratory data analysis

Bivariate exploratory data analysis

Function between response and predictors

\[\text{carb} = f(\text{calories}, \text{bakery}) + \epsilon\]

  • Goal: Determine \(f\)
  • How do we determine \(f\)?
    • Make an assumption about the functional form \(f\) (parametric model)
    • Use the data to fit a model based on that form

Determine \(f\)

  1. Choose the functional form of \(f\), i.e., choose the appropriate model given the response variable
  • Suppose \(f\) takes the form of a linear model
    \[y = f(\mathbf{X}) = \beta_0 + \beta_1 x_1 + \dots + \beta_p x_p + \epsilon\]
  1. Use the data to fit (or train) the model, i.e, estimate the model parameters, \(\beta_0, \beta_1, \ldots, \beta_p\)

Carb vs. Calories

\[\text{carb} = \beta_0 + \beta_1 ~\text{calories} + \epsilon\]

Carb vs. Calories + Bakery

\[\text{carb} = \beta_0 + \beta_1 ~\text{calories} + \beta_2 ~\text{bakery} + \epsilon\]

Carb vs. Calories + Bakery (with interaction)

\[{\small \text{carb} = \beta_0 + \beta_1 ~\text{calories} + \beta_2 ~\text{bakery} + \beta_3 ~ \text{calories} \times \text{bakery} + \epsilon}\]

Simpson’s Paradox

Example: Palmer’s Penguins

Size measurements, clutch observations, and blood isotope ratios for adult foraging Adélie, Chinstrap, and Gentoo penguins observed on islands in the Palmer Archipelago near Palmer Station, Antarctica.

Example: Palmer’s Penguins

What does the relationship between Length and Depth look like?

Example: Palmer’s Penguins

What does the relationship between Length and Depth look like now?

Simpson’s Paradox

Simpson’s Paradox is when there is a clear relationship between two variables but when you introduce a third variable that relationship disappears of reverses.

Statistical model vs. regression equation

Statistical model (also known as data-generating model)

\[{\small \text{carb} = \beta_0 + \beta_1 ~\text{calories} + \beta_2 ~\text{bakery} + \beta_3 ~ \text{calories} \times \text{bakery} + \epsilon}\]

Models the process for generating values of the response in the population (function + error)


Regression equation

Estimate of the function using the sample data

\[{\small \hat{\text{carb}} = \hat{\beta}_0 + \hat{\beta}_1 ~\text{calories} + \hat{\beta}_2 ~\text{bakery} + \hat{\beta}_3 ~ \text{calories} \times \text{bakery}}\]

Why fit a model?

  • Prediction: Expected value of the response variable for given values of the predictor variables

  • Inference: Conclusion about the relationship between the response and predictor variables

  • What is an example of a prediction question that can be answered using the model of carb vs. calories and bakery?

  • What is an example of an inference question that can be answered using the model of carb vs. calories and bakery?

Recap

  • We can use exploratory data analysis to describe the relationship between two variables

  • We make an assumption about the relationship between variables when doing linear regression

  • The two main objectives for fitting a linear regression model are (1) prediction and (2) inference

To-Do

  • For Wednesday
    • Complete and submit AE 02
    • Completed readings
  • For Monday
    • HW 01

References