The Big Picture
Topics
- Data analysis life cycle
- Reproducible data analysis
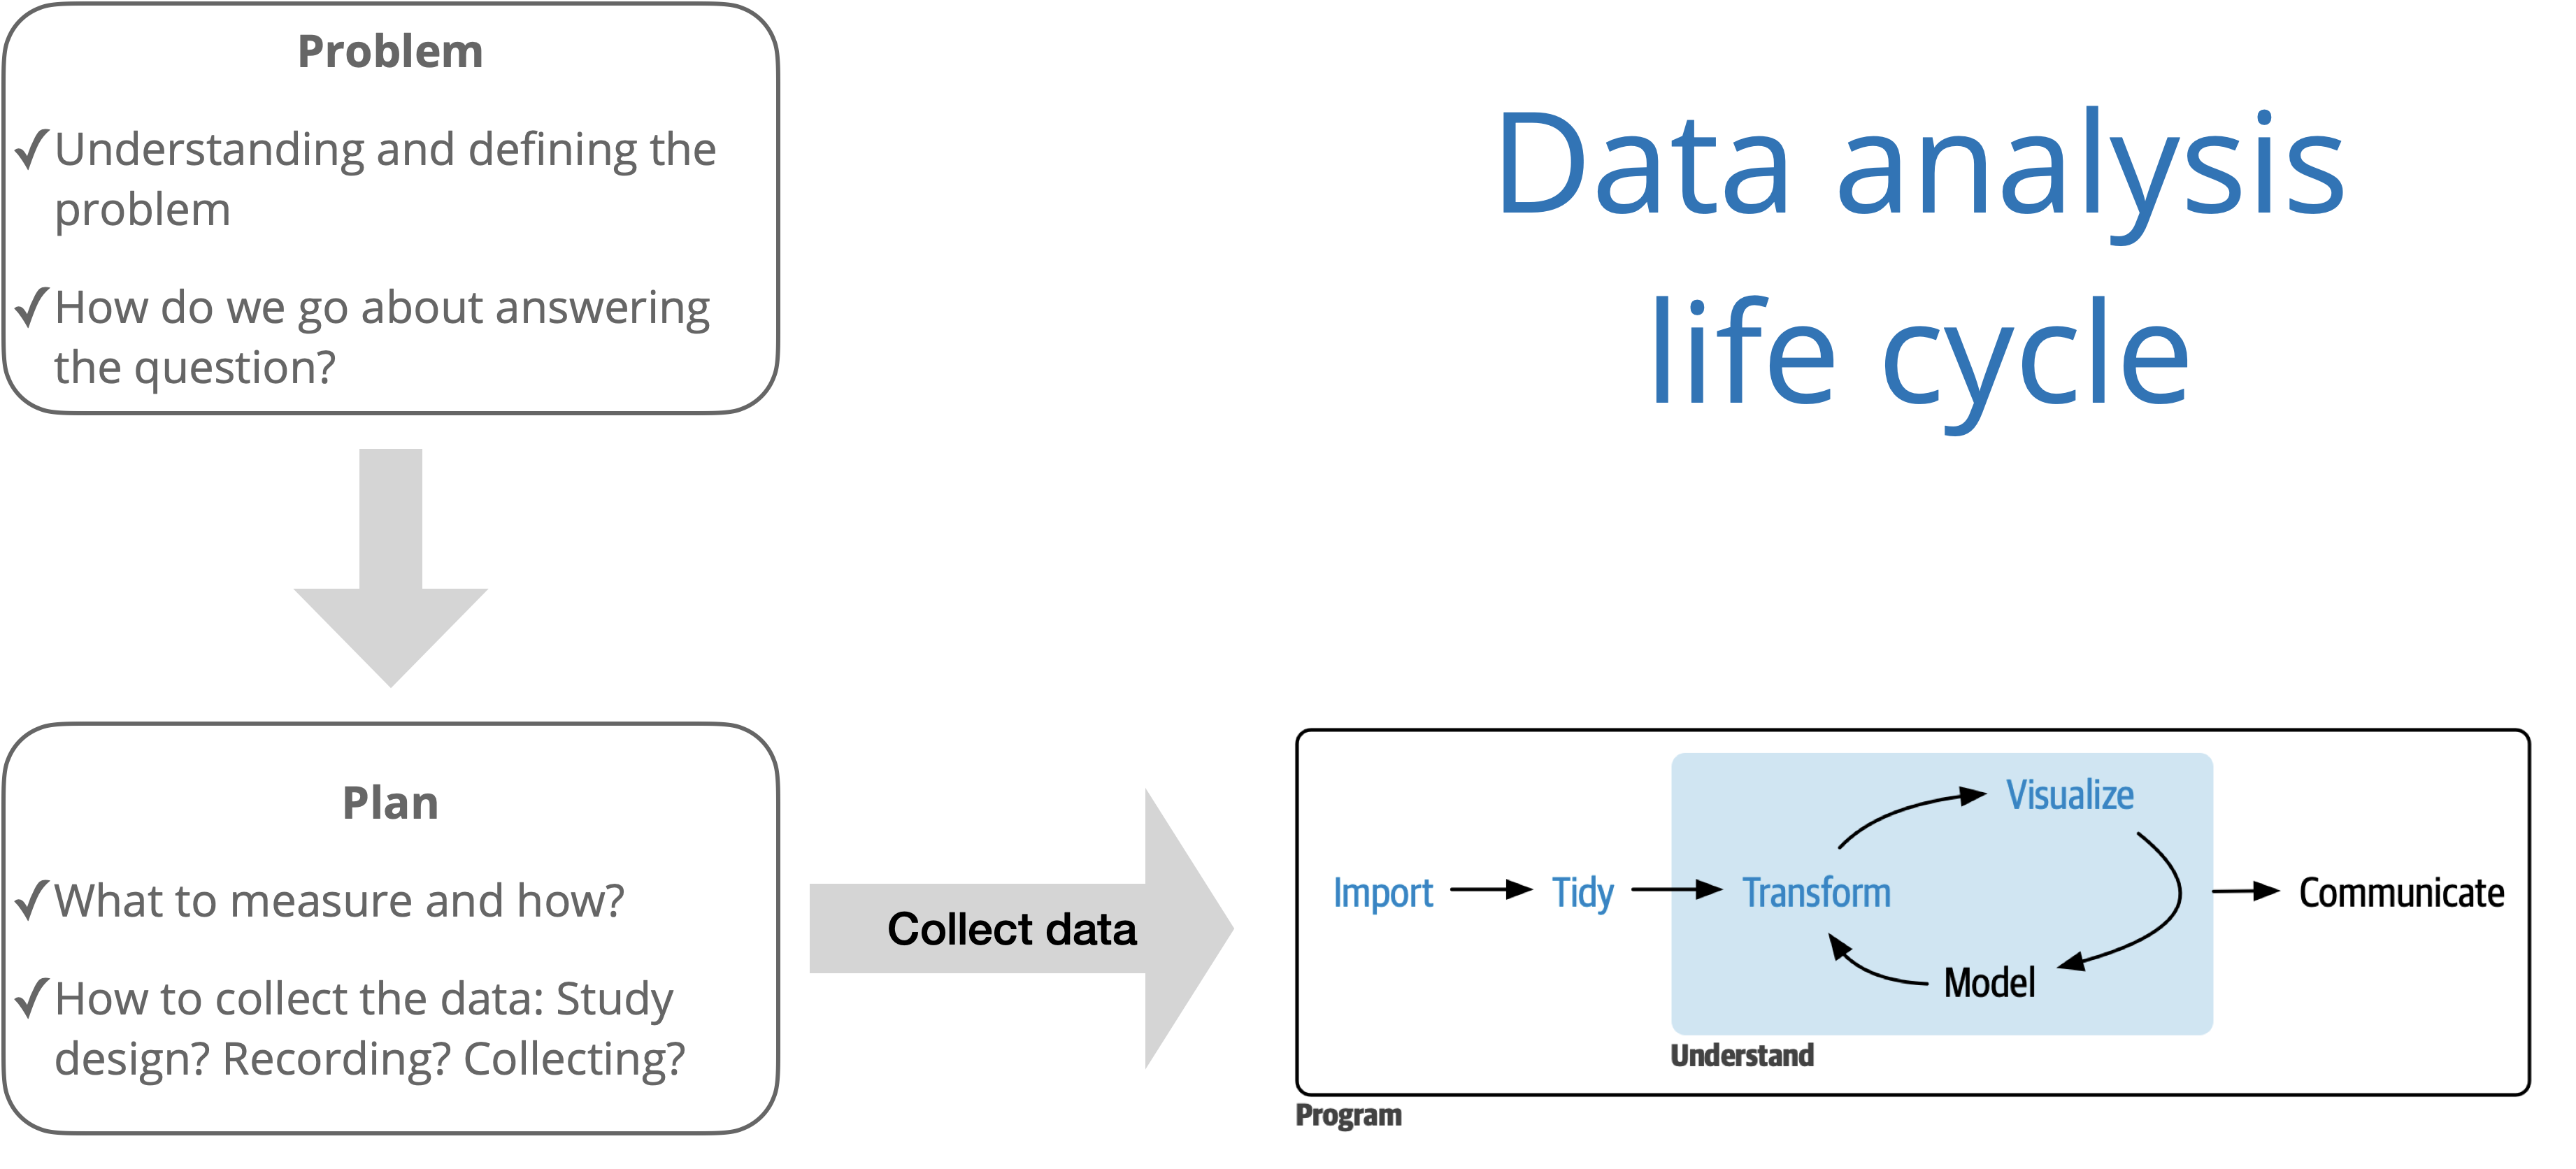
Source: R for Data Science with additions from The Art of Statistics: How to Learn from Data.
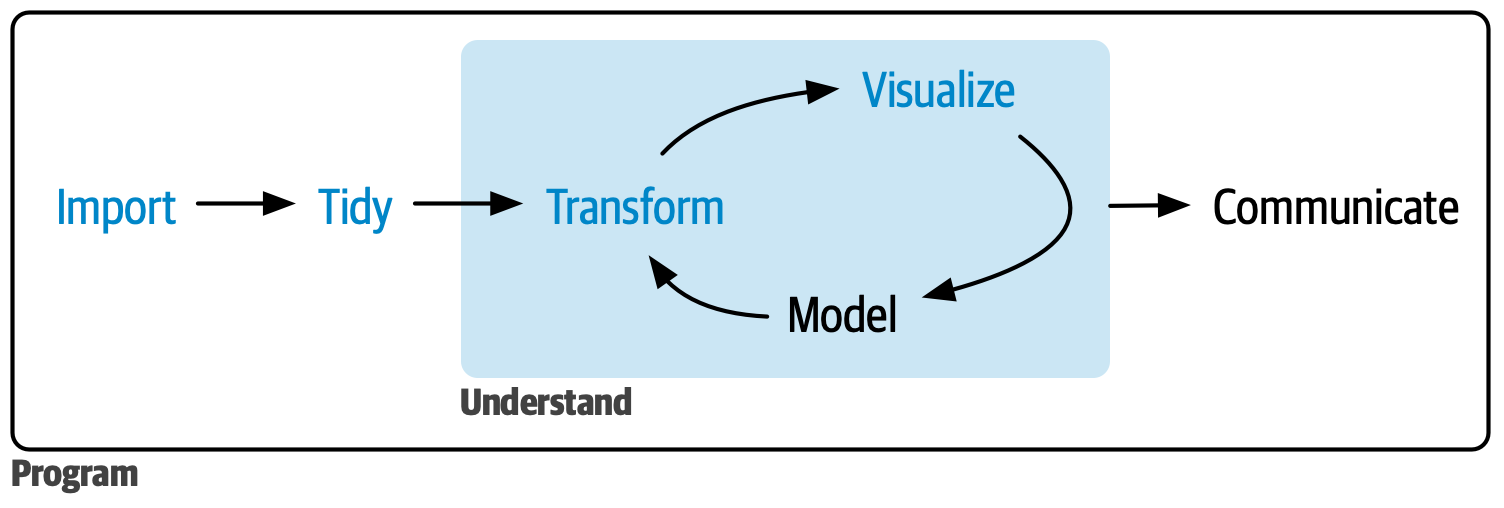
Source: R for Data Science
Reproducibility
Reproducibility checklist
What does it mean for an analysis to be reproducible?
Near term goals:
✔️ Can the tables and figures be exactly reproduced from the code and data?
✔️ Does the code actually do what you think it does?
✔️ In addition to what was done, is it clear why it was done?
Long term goals:
✔️ Can the code be used for other data?
✔️ Can you extend the code to do other things?
Why is reproducibility important?
Results produced are more reliable and trustworthy (Ostblom and Timbers 2022)
Facilitates more effective collaboration (Ostblom and Timbers 2022)
Contributing to science, which builds and organizes knowledge in terms of testable hypotheses (Alexander 2023)
Possible to identify and correct errors or biases in the analysis process (Alexander 2023)
When things go wrong
| Reproducibility error | Consequence | Source(s) |
|---|---|---|
| Limitations in Excel data formats | Loss of 16,000 COVID case records in the UK | (Kelion 2020) |
| Automatic formatting in Excel | Important genes disregarded in scientific studies | (Ziemann, Eren, and El-Osta 2016) |
| Deletion of a cell caused rows to shift | Mix-up of which patient group received the treatment | (Wallensteen et al. 2018) |
| Using binary instead of explanatory labels | Mix-up of the intervention with the control group | (Aboumatar and Wise 2019) |
| Using the same notation for missing data and zero values | Paper retraction | (Whitehouse et al. 2021) |
| Incorrectly copying data in a spreadsheet | Delay in the opening of a hospital | (Picken 2020) |
Source: Ostblom and Timbers (2022)
Toolkit
Scriptability \(\rightarrow\) R
Literate programming (code, narrative, output in one place) Jupyter-notebooks and Deepnote
Version control \(\rightarrow\) Git / GitHub (Beyond the scope of this course)
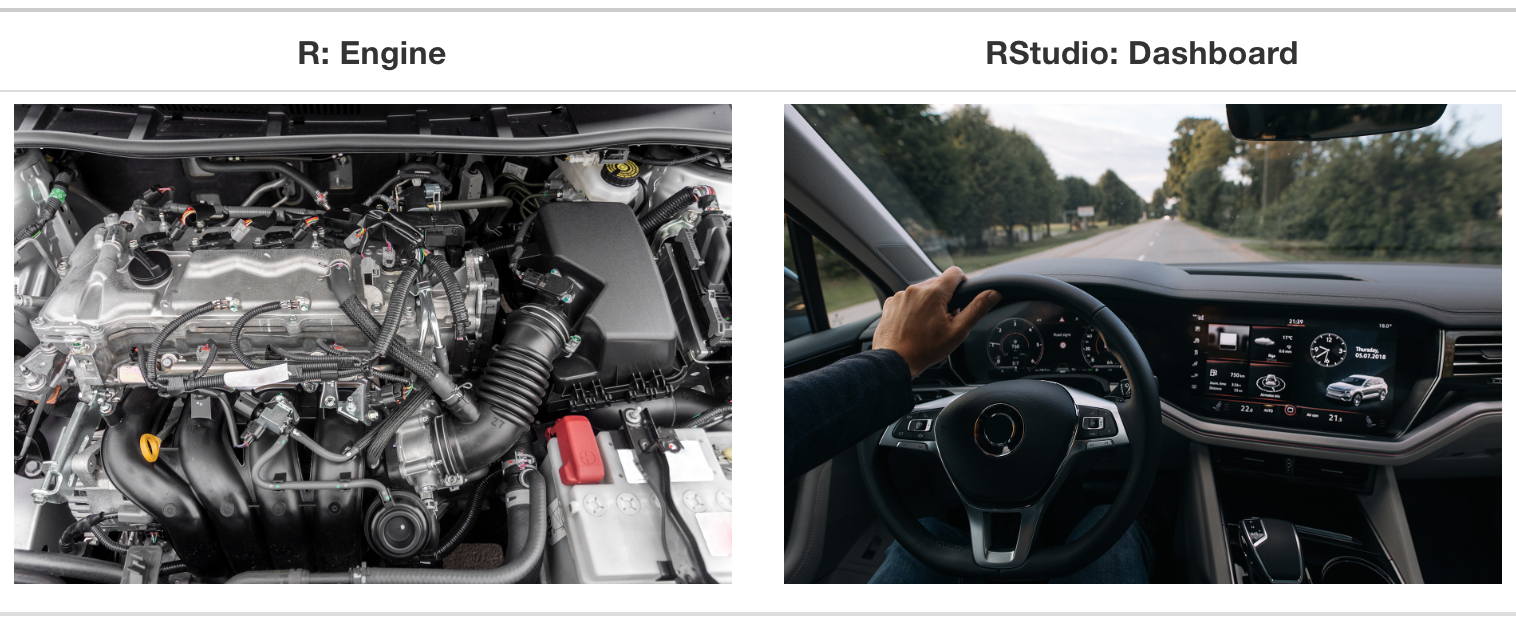
R and RStudio
R is a statistical programming language
Jupyter notebooks are a convenient interface for R
Deepnote
Let’s all create a Deepnote account using our CofI email addresses.
Deepnote
Fully reproducible reports – the analysis is run from the beginning each time you Run the full notebook
Code blocks for writing code and markdown blocks for writing prose
Visual editor to make document editing experience similar to a word processor (Google docs, Word, Pages, etc.)
How will we use Deepnote?
Every application exercise and assignment is written in a Jupyter notebook
You’ll have a template notebook to start with
The amount of scaffolding in the template will decrease over the semester
Our first AE!
Group Work Roles
Any time we are working on AEs, I will randomly assign you to groups of two or three. Each person will have a role:
- Coder:
- Shares screen and is the only person to type.
- Runs code, saves work, and makes the submission.
- Reads comments back when asked and asks for clarification when unsure.
- Developer:
- Directs the next steps: explains intent, outlines logic, and points out likely errors.
- Watches output, reads error messages aloud, and suggests targeted fixes.
- Communicator:
- Looks up help when needed.
- Reports group answers to the class.
Getting Started
Complete the activity.
Recap
- The data analysis life cycle involves collecting, cleaning, exploring, modeling, and communicating data.
- Reproducibility ensures that results can be trusted and analyses can be repeated or extended.
- Common errors in data handling can have serious consequences—using reproducible tools helps avoid these problems.
- R is the language we use for analysis; RStudio is the IDE; Quarto is for creating reproducible documents.
- Group work in class uses defined roles to help everyone participate and learn.
For Monday
- Complete and submit AE 01
- Complete readings